|
|
||||||
|
|

October 26, 2009 Rumors of the Death of the Credit Crisis Are Greatly Exaggerated In recent months, the rate of mortgage foreclosures has lagged the rate of delinquencies, indicating that banks have been reluctant to foreclose, and prompting some observers to assume that banks are now more lenient and the foreclosures will simply be averted. Indeed the FDIC has encouraged this sort of "forbearance" - which typically involves a deferral or small reduction in home payments, generally lasting about 6 months. The problem is that the majority of these deferrals ultimately end in foreclosure. This is particularly likely to be true given prevailing weakness in employment conditions. Indeed, the Office of Thrift Supervision recently reported that more than 50% of mortgages modified in the first half of 2008 have already missed at least two months of payments so far in 2009. Last week, I received several notes quoting the same analyst who suggested that the majority of Alt-A and Option-ARM loans have already been modified, that associated losses have already been taken, and that the "leading indicators" of foreclosure have improved. All of these assertions are fabrication. Indeed, Richard Posner recently highlighted a study by the Federal Reserve (also cited in the Economist), which found that in a very large sample of residential mortgages, only 3 percent of seriously delinquent borrowers received a modification of their mortgage "that reduced their monthly payments in the year after they got into trouble." Only 8 percent of those borrowers received any kind of modification. Meanwhile, it is beyond reason to believe that homeowners would voluntarily modify Option-ARMs before the reset date, when those mortgages currently allow them to arbitrarily choose their payments or pay interest only until that date arrives. According to Fitch, nearly 90% of of Option-ARMs have yet to reset, and of those, about 94% of them have used the minimum monthly payments to allow the loans to "negatively amortize." This does not seem very supportive of the idea that the problem is behind us. As for "leading indicators" of delinquency and foreclosure, quite simply, the best leading indicators are high loan-to-value ratios coupled with a dislocation such as job loss, illness, change in family status, or an onerous mortgage reset. Weekly unemployment claims continue to ride well above a half-million new claims a week, and the unemployment rate would be well above 10% but for workers actually leaving the workforce and no longer being counted as unemployed. In order for the unemployment rate to enjoy any sustained decline, we will need to observe job creation sufficient to absorb the typical rate of entry into the work force (about 150,000 workers per month), not to mention any returning workers. Still, for a few months, we may continue to see a bit more restraint in actual foreclosures than we observe in delinquency statistics, but aside from a slight pullback in September - well within the range of month-to-month statistical noise - foreclosures themselves are also hitting new records. "According to RealtyTrac, one in every 136 homes in the US received a foreclosure filing during Q309, the highest reported quarterly foreclosure rate since RealtyTrac began issuing its report in the first quarter of 2005. Foreclosure filings increased 5% from the previous quarter and climbed 23% from Q308, according to the report. Nearly 938,000 homeowners received a foreclosure filing in Q309. Filings in September dipped 4% from the month before but jumped 29% from September 2008. Despite the monthly decrease, September registered the third highest monthly total since RealtyTrac began reporting - trailing only July and August of 2009." HousingWire - October 25, 2009 "The number of properties on the market may be much larger than anyone thought and appears likely to swamp South Florida with more deeply discounted homes, clouding the prospects for a housing recovery. Figures from the Florida Association of Realtors released Friday show that South Florida's median home prices have stabilized over the past several months and sales are up year-over-year as the number of properties on the market shrinks. But an analysis of the so-called shadow market done for The Miami Herald suggests the number of homes and condos in the pipeline to come on the market in South Florida is nearly five times larger than all residential properties currently listed for sale by Realtors. LPS Applied Analytics, a firm that supplies loan data to the federal government, did the analysis on the shadow market, which refers to properties that will eventually be listed for sale -- because they are about to enter foreclosure, are in foreclosure or already owned by banks." Miami Herald, October 24, 2009 The idea that foreclosures will continue to lag delinquencies because of forbearance assumes that banks will hold the impaired, non-performing mortgages on their books indefinitely as if they were good assets. This may go on for a few months, but will ultimately be unsustainable if delinquencies accelerate, as we can expect from the reset schedule. In short, rumors of the death of the mortgage crisis appear to be greatly exaggerated. Research Update In recent months, I've strongly rejected the notion that the credit crisis has been conveniently placed behind us and that the U.S. is now in a typical post-war economic recovery (and can be approached as such from an investment perspective). This view continues to strike me as dangerous and even naïve. At the same time, however, I have openly struggled with the question of how to approach the data, when the implications of typical post-war data conflict with the implications of the data when we include previous post-crash market dynamics. In my August 31, 2009 market comment, A Tale of Two Data Sets, for example, I observed: "We try to align our investment positions based on the return to risk profile that we can expect, on average, given prevailing market conditions. Our dilemma here is this. There are two sets of data from which to draw those averages. One would include ordinary run-of-the-mill economic and market cycles using post-war data from the U.S. alone. The other is broader, and includes market behavior, both in the U.S. and in other countries, following major crashes. Extended economic dislocations were typically required before fundamentals durably improved. "Even giving the two possibilities equal weight is harsh, because as I've repeatedly noted, post-crash markets have included advances as large, and larger, than we've observed since March, but with devastating follow-through. In the current situation, our only choice is to consider the full data set, because we have no basis - whatsoever - to rule post-crash dynamics out in view of prevailing economic conditions." In the course of exhaustive modeling and testing of various ways to resolve this dilemma, I took an approach a couple of weeks ago that has to do with the concept of "convexity." Forgive the bit of math here, but it is important. Let's start by looking at a "convex" function.
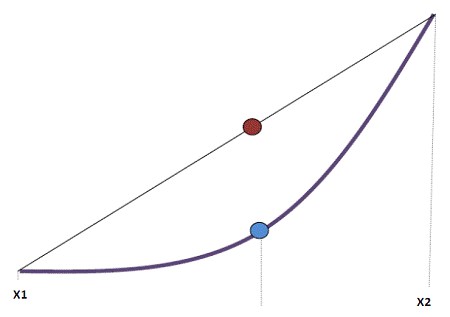
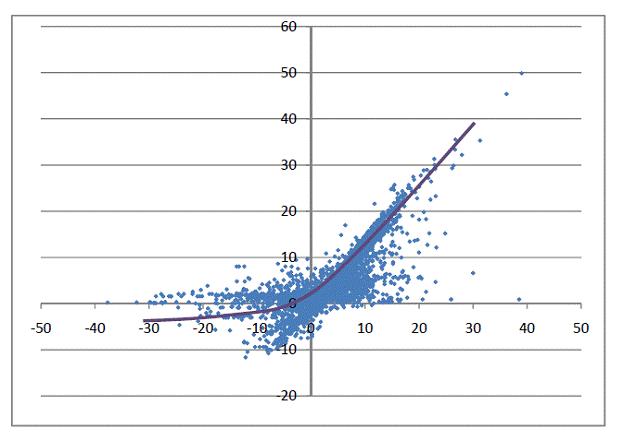
Consider the convex function f(x) above and the two possible values of x at either end of the graph - call them x1 and x2. Suppose we place some amount of weight w on the possibility that x1 will be true, and the remaining weight (1-w) on the possibility that x2 will be true. Given that f(x) is convex, it is then true that: w{f(x1)} + (1-w){f(x2)} > f(w{x1}+(1-w){x2}) In plain English, the average of the function evaluated separately at x1 and x2 is greater than the function of the average of x1 and x2. This is shown in the diagram above. If we take the average of x1 and x2 (the endpoints of the graph), the function of the average x is the blue dot. But if we evaluate the function at x1 and x2 and average the outcomes, the average value of the function is the red dot. What could this possibly have to do with investing in this uncertain market? Well, suppose those x values are market returns implied by different states of the world, and f(x) is the return of a particular investment strategy. For a linear investment strategy (like buy-and-hold), f(x) = x. So returns for a buy-and-hold investor are simply a one-to-one reflection of market returns. For that sort of investor, it follows that there is no difference between the function of the average and the average of the function. If we are faced with two possible data sets that might describe the world, we can simply take the set of possible outcomes and use the weighted expected return as the basis for how we ought to invest. But consider instead the profile of returns from a convex investment strategy. You can assume that the graph below is hypothetical. Market returns are measured on the horizontal axis and strategy returns are on the vertical axis.
The curvature or "convexity" of the profile above is characteristic of an investment strategy having with a heavy risk-management component. It has some similarity to the payoff profile of a call option, except that a call option has a negative payoff when market returns are zero, because holding a call option suffers a decay of time premium, without being offset by any strategic gain. For this particular strategy, notice that the scatter of returns is very different from the profile of a buy-and-hold strategy, which would instead form a perfect 45 degree line for both positive and negative returns. The scatter also indicates that the strategy does not closely track the market, in general. For our purposes, the most important feature of this scatter is that the overall profile is convex. Now, I should note that this overall convexity doesn't imply "point" convexity (which would suggest that the strategy could simply be evaluated at every possible point and then averaged). Rather, the profile is convex because given a particular data set, the strategy responds to probable or emergent weakness in a manner that is often - though not always - sufficient to mute its impact on returns. What struck me a couple of weeks ago was that since the return profile of the strategy we actually employ in the Strategic Growth Fund is essentially convex, there is a clear solution to the question of how to properly approach two competing data sets. Rather than weighting the data sets directly, and evaluating our investment strategy based on the average expected return, the convexity of our strategy suggests that we may do better by evaluating our strategy based on each data set separately, and then weighting the resulting actions. This has the additional benefit of reducing "model risk" by essentially diversifying the "portfolio" of decisions that drives our returns (and is one of the reasons why we don't feed the expected returns from our market analysis into our stock selection methodology). Again, for a convex strategy, the average of the function dominates the function of the average. For a linear strategy like buy-and-hold, there is no difference Presently, the weight of the evidence puts us on the defensive regardless of whether one assumes a typical post-war environment or a more hostile post-crash environment, but my impression is that if we observe a significant correction without serious deterioration in market internals, the "post-war recovery" scenario would indicate a moderately invested position, and we would take a partial exposure to market risk on that basis. For now, the Strategic Growth Fund is defensive. Market Climate As of last week, the Market Climate for stocks was characterized by unfavorable valuations. Market action was mixed, with breadth and generally positive trends in major indices being the most favorable aspects, while strenuously overbought conditions persist. We also saw some "climax reversals" and other features characteristic of exhaustion late last week, but that evidence is tentative, and would probably be cleared on fresh highs in the major indices. For now, the Strategic Growth Fund remains well hedged, though we've shifted the composition of our hedge modestly. The relatively low level of option volatility last week, coupled with a fresh high early in the week and a selloff on Friday, allowed us to improve the effectiveness of our hedge with less upside "drag." Specifically, we modestly reduced the number of straight long-put / short-call combinations in the Fund while simultaneously raising the strikes of some of our put options. Overall, the Fund remains well hedged. In bonds, the Market Climate last week was characterized by modestly unfavorable yield levels and modestly favorable yield pressures. The Strategic Total Return continues to carry a duration of about 3 years, allocated between TIPS and straight Treasuries, with about 1% of assets in precious metals shares, about 4% of assets in foreign currencies, and about 4% of assets in utility shares. --- The foregoing comments represent the general investment analysis and economic views of the Advisor, and are provided solely for the purpose of information, instruction and discourse. Prospectuses for the Hussman Strategic Growth Fund, the Hussman Strategic Total Return Fund, the Hussman Strategic International Fund, and the Hussman Strategic Dividend Value Fund, as well as Fund reports and other information, are available by clicking "The Funds" menu button from any page of this website. |
|||||||||||||||||||||||||
|
For more information about investing in the Hussman Funds, please call us at
1-800-HUSSMAN (1-800-487-7626) 513-326-3551 outside the United States Site and site contents © copyright Hussman Funds. Brief quotations including attribution and a direct link to this site (www.hussmanfunds.com) are authorized. All other rights reserved and actively enforced. Extensive or unattributed reproduction of text or research findings are violations of copyright law. Site design by 1WebsiteDesigners. |