|
|
||||||
|
|

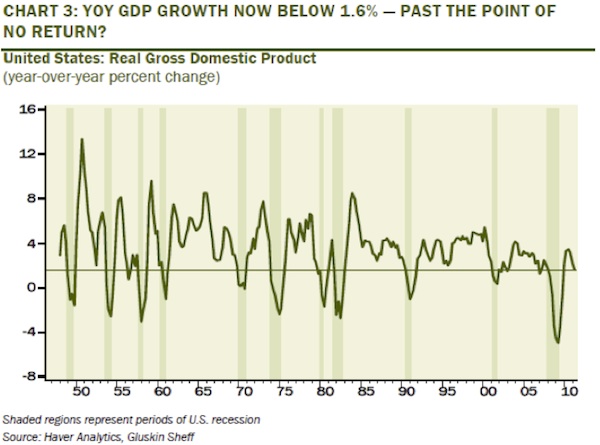
August 1, 2011 More Than Meets the Eye On the surface, the agreement on the U.S. debt ceiling can be expected to produce a significant relief rally in the financial markets, particularly if one views uncertainty on that front to be the reason for last week's market weakness. That prospect, coupled with the predictable support that investors gave the S&P 500 precisely at its 200-day moving average, prompted us to cover just over 10% of our short calls, but retaining full hedge on the remainder of our holdings, and keeping a strong line of protection about 2% below Friday's closing levels using index put options (near that 200-day). That's still a fairly tight hedge, because unfortunately, the ensemble of observable data continues to indicate negative expected returns. So while we've modified our position slightly to allow for reduced uncertainty on the deficit front, and the likelihood of "knee jerk" technical support at the widely-followed 200-day average, the expected return/risk profile in stocks remains negative in our estimation. Of course, our precise hedge will change from day-to-day as market conditions change. Part of the problem here is that market internals have deteriorated badly, particularly last week, where breadth was nearly 10-to-1 in favor of declining issues, and downside leadership exerted itself with more stocks hitting new 52-week lows than new highs. Meanwhile, though new claims for unemployment dipped just below 400,000 last week, we would be more encouraged if the margin was greater, and sustained over a period of many weeks. At present, the 4-week average is running at about 414,000, a level which has historically been associated with growth of only about 30,000-50,000 in monthly non-farm payrolls on average (see the July 11 comment), though there's certainly month-to-month noise around those averages. The overall impression from the data suggests the possibility that there is more information in the recent breakdown in market internals than can be explained by debt ceiling concerns alone. On that note, there are emerging economic signals whose leading tendencies are strong enough to make a review worthwhile. We'll begin with our own recession warning composite, which accurately signaled oncoming recessions in 2000 and 2007 (see the November 12, 2007 comment Expecting A Recession ). That particular conformation of indicators never deteriorated sufficiently in 2010 to provoke a recession warning, though the deterioration in the ECRI leading index and other measures clearly indicated serious concern. In any event, QE2 effectively forestalled incipient economic weakness in 2010. Given that second quarter GDP came in at just 1.3% annually, and first quarter GDP growth was revised down to just 0.4% (from a prior estimate of 1.9%), it is wholly unclear that the Fed's extraordinary actions have been worth the market distortions, predictable commodity hoarding, injury and social unrest among the world's poor (resulting from food and energy price increases) and significant "unwinding" risks that this policy has produced. The components of our recession warning composite might be called "weak learners" in that none of them, individually, has a particularly notable record in anticipating recessions. The full syndrome of conditions, however, captures a critical "signature" of recessions. That signature of "early warning" conditions is based on financial market indicators including credit spreads, equity prices and yield curve behavior, coupled with slowing in measures of employment and business activity. Every historical instance of this full syndrome has been associated with an ongoing or immediately impending recession. The components (which I've reordered for simplicity) are: 1: Widening credit spreads: An increase over the past 6 months in either the spread between commercial paper and 3-month Treasury yields, or between the Dow Corporate Bond Index yield and 10-year Treasury yields. 2: Falling stock prices: S&P 500 below its level of 6 months earlier. This is not terribly unusual by itself, which is why people say that market declines have called 11 of the past 6 recessions, but falling stock prices are very important as part of the broader syndrome. 3: Weak ISM Purchasing Managers Index: PMI below 50, or, 3: (alternate): Moderating ISM and employment growth: PMI below 54, coupled with slowing employment growth: either total nonfarm employment growth below 1.3% over the preceding year (this is a figure that Marty Zweig noted in a Barron's piece many years ago), or an unemployment rate up 0.4% or more from its 12-month low. 4: Moderate or flat yield curve: 10-year Treasury yield no more than 2.5% above 3-month Treasury yields if condition 3 is in effect, or any difference of less than 3.1% if 3(alternate) is in effect (again, this criterion doesn't create a strong risk of recession in and of itself). At present, both measures of credit spreads in condition 1 are widening, the S&P 500 is within about one percent of its level 6 months ago, the Purchasing Managers Index is at 55.3%, total nonfarm payrolls have grown by only 0.8% over the past year, the unemployment rate is up 0.4% from its March 2011 low, and the Treasury yield spread is just 2.7%. From the standpoint of this composite, we would require only modest deterioration in stock prices and the ISM index to produce serious recession concerns. This impression is supported by a number of other observations. First, the year-over-year growth in U.S. real GDP is now just 1.6%. As David Rosenberg notes (via John Mauldin), this level of growth has historically been slow enough to anticipate an oncoming recession.
Wells Fargo's senior economist Mark Vitner reiterated the point last week, noting that since 1950, year-over-year growth in real GDP has dipped below 2% on 12 occasions. In 10 of those instances, the economy was already in recession or quickly entered one. The exceptions were 1956 and 2003. For our part, we've always believed that the strongest evidence is obtained by combining multiple data points into a single "gestalt." So I have difficulty concluding that the U.S. is on the verge of recession simply because the year-over-year growth rate has stalled. At the same time, we are closely monitoring a much broader set of data, because the deterioration has been very rapid. I should be clear - the evidence is not yet convincing that a recession is imminent, but it is also important to recognize that the developing risks are greater than most investors seem to assume at present. I should also note that while our recession warning composite uses the ISM Purchasing Managers Index as a component, we believe it is important to monitor a much broader set of survey-based data, including the ISM (National, Chicago, Cincinnati, Milwaukee) and Federal Reserve (Empire Manufacturing, Philadelphia, Richmond, Dallas) indices. As you can see from the chart below, the combined evidence from these measures collapsed sharply during the summer of 2010, and enjoyed a brief bounce as the Fed embarked on its second round of quantitative easing. The deterioration in recent months is of significant concern, though again, we would need to see further weakness in a number of measures before attaching a significant probability to an oncoming recession.
Notably, the full effect of QE2 on economic activity was to provide transitory bump to short-term growth. Of course, that's not a surprise, as we knew (and the Fed should have known) that there is virtually no "wealth effect" from stock market values to real GDP (specifically, the historical impact has been an increase of just 0.03-0.05% in GDP for every 1% increase in stock market capitalization). Yet, in order to achieve this pitiful amount of can-kicking, the Fed has now leveraged its balance sheet to 55-to-1, driving the monetary base to 18 cents for every dollar of nominal GDP. Notably, we've never observed Treasury bill yields at even 2% when the base has been anything greater than 10 cents per dollar of nominal GDP. Given the non-linear relationship between short-term interest rates and the amount of base money per dollar of GDP, a non-inflationary increase in interest rates to just 0.50% would presently require approximately $1 trillion in Treasury bond sales by the Fed, more than reversing its entire volume of purchases under QE2 (see Charles Plosser and the 50% Contraction in the Fed's Balance Sheet ). It's difficult to judge QE2 as anything but a failure in producing meaningful economic growth - at least anything commensurate with the distortions and risks it has created. Again, not that that any success should have been expected. Still, what's even more disheartening is that investors continue to pin their hopes on yet another round of quantitative easing, like teenagers at a Def Leppard concert who don't know any other song but "Pour some sugar on me." A review of several confirming indicators of oncoming recession (see again the 2007 comment Expecting A Recession ) may prove useful in the coming months, either to ease concerns or to corroborate them. These indicators include A sudden widening in the "consumer confidence spread," with the "future expectations" index falling more sharply than the "present situation" index. In general, a drop in consumer confidence by more than 20 points below its 12-month average has accompanied the beginning of recessions. Low or negative real interest rates , measured by the difference between the 3-month Treasury bill yield and the year-over-year rate of CPI inflation. Falling factory capacity utilization from above 80% to below 80% has generally accompanied the beginning of recessions. Slowing growth in employment and hours worked. The unemployment rate itself rarely turns sharply higher until well into recessions (and rarely turns down until well into economic recoveries). So while the unemployment rate is an indicator of economic health, it is not useful to wait for major increases in unemployment as the primary indicator of oncoming economic changes. As for employment-related data, slowing growth in employment and hours worked tend to accompany the beginning of recessions. Specifically, when non-farm payrolls have grown by less than 1% over a 12 month period, or less than 0.5% over a 6 month period, the economy has always been at the start of a recession. Similarly, the beginning of a recession is generally marked by a quarterly decline in aggregate hours worked. From the standpoint of these indicators, the "future expectations" component of consumer confidence remains above the "present situation" measure. The future expectations (Conference Board) reading of 75 is below its own 12-month average of about 79, but has not collapsed, and we haven't yet seen the sharp deterioration in the overall confidence figure that typically accompanies the beginning of recessions. The other indicators are less sanguine, with real interest rates significantly negative, capacity utilization deteriorating slightly to 76.7% (it never made it above 80% in the current recovery), and growth in non-farm payrolls of just 0.8% over the past year, but still hanging in at 0.6% over the past 6 months. In June, the aggregate weekly hours index dropped to 93.6 from 93.9, but remained a bit higher than the 93.3 reading from March of this year. Our overall impression is that the weakness we observed in the markets last week, particularly given the heavy damage to market internals, may convey more information than simply concern about the debt ceiling. There seems little doubt that investors will take a measure of relief from a favorable resolution of that situation. A failure of that advance would suggest that there is more to recent market weakness than meets the eye, and would contribute to more significant concerns about the economy itself. Clearly, some of the more important indicators to monitor in the next few months will include the S&P 500 (particularly a decline below its level of 6 months prior), the ISM Purchasing Managers Index (anything at or below 54), Consumer Confidence (any significant decline in the Conference Board figure below its 12-month average of 60 or so, or a further contraction in the spread between "future expectations" and "present situation"), non-farm payroll growth (less than 0.5% over a 6-month period), capacity utilization (further weakness of even a point or two), and the aggregate weekly hours index (a decline below its level of 3 months earlier). For now, our concerns remain focused on significant "core" issues facing the markets and the economy, including overvaluation, compressed risk premiums, over-reliance of investors on the maintenance of record profit margins, unresolved mortgage strains, and sovereign debt problems. Valuations remain rich on the basis of normalized earnings, market internals have deteriorated considerably, and recession risks are increasing. There are certainly various policy developments that are likely to provoke investor enthusiasm from time to time. What is important to us is the weight of the evidence. For stocks, that evidence remains unfavorable, but we've introduced some modest flexibility to our hedge while retaining a strong defense. For the economy, the evidence is of growing concern, but is not decisive enough to support the expectation of an oncoming recession. Still, the developing risks of an economic downturn are greater than investors widely seem to assume. Market Climate As of last week, the Market Climate in stocks was characterized by unfavorable valuations and further deterioration in market action. While Wall Street analysts continue to view valuations as attractive on the basis of forward operating earnings that themselves incorporate assumptions of record profit margins, it is important to recognize that they were equally sanguine about these measures of valuation at the 2007 market peak. I cannot emphasize frequently enough that profit margins are cyclical, and that as claims to a long-term stream of cash flows, stocks should be valued on the basis of normalized earnings, not on the basis of projected earnings, assuming record profit margins, during an economic recovery. On the positive side, last week's decline was sufficient to increase our expectation for 10-year total returns on the S&P 500 to 4.1% annually. This is still unsatisfactory in view of probable risks, of course, but it is slightly better than we observed several weeks ago. We modestly adjusted our hedges last week to allow for some potential enthusiasm on a debt-ceiling hike, as well as some fairly knee-jerk "buy-the-dip" behavior from technical investors encountering the 200-day moving average for the S&P 500. We covered about 10% of our short calls in Strategic Growth on last week's decline, though we retain a strong line of defense about 2% below present levels, and the majority of our position remains tightly hedged. Overall, the Fund remains defensive, as the present ensemble of evidence continues to indicate negative expected returns on our measures. Strategic International Equity remains about 20% unhedged, as conditions in international markets are more mixed than for the U.S. alone. In bonds, the Market Climate last week was characterized by unfavorable yield levels and mixed yield pressures. Despite ostensible debt concerns, Treasury securities generally benefited from "safe haven" demand last week. Strategic Total Return Fund continues to have a duration of about 2.5 years, mostly in intermediate-term Treasury notes, with the primary source of day-to-day fluctuations driven by a roughly 20% exposure to precious metals shares. Treasury bill yields jumped slightly last week, to 0.10%, reflecting at least slight concern that a debt agreement might not be reached. From our perspective, the most important issue is whether than 10 basis point jump goes away immediately once the debt ceiling is raised. It had better. As I've detailed at length in other weekly comments, even a short-term yield of 10 basis points on Treasury bills is incompatible with price stability given the present size of the U.S. monetary base. A yield of 10 basis points is not inflationary to the extent that it reflects a pure "risk premium" due to a reduction of demand from investors. But without default concerns, even 10 basis points is enough to put pressure on the marginal value that people place on non-interest-bearing base money. Anything that makes cold, hard cash a "hot potato" is hostile to price stability. In short, it will be important to watch that 3-month Treasury bill yield - it should quickly drop back toward zero here. If it does not, inflation concerns would be immediately raised. On a related note, we're sometimes asked why we don't include the debt of Fannie Mae and Freddie Mac when we discuss the debt of the U.S. government. There are two reasons for this. The first is that most, though certainly not all, of that debt is backed by a stream of cash flows from homeowners that is paid on that debt. So to the extent that the payments on that debt are being made by homeowners, it is incorrect to view that debt as an obligation of the U.S. government. The second reason is that Fannie Mae and Freddie Mac are not, in fact, agencies of the U.S. government (as Ginnie Mae, which finances FHA loans, is). This, of course, is also why the first round of quantitative easing was in violation of Section 14.1(2) of the Federal Reserve Act (see The Case Against the Fed ). The "guarantee" that Fannie and Freddie sold to investors is a corporate guarantee, not a federal one. Now, it's clear that investors widely view the federal guarantee as "implicit," and the Treasury under Tim Geithner has made it explicit through 2012. But if anyone is concerned about default risk in the U.S., the place they really should look first is at the debt of Fannie and Freddie, as it is debt of insolvent institutions whose disposition has not been agreed upon at all within Congress. It is fascinating that investors don't seem to have this on their radar. Still, if Congress was to decide to make those bondholders whole for an extended period of time, then to the extent that explicit appropriations were not made and funded through taxes or issuance of new Treasury debt, the subsidized portion of Fannie and Freddie's debt would be appropriately viewed as an obligation of the Federal government. I continue to believe that the primary drag on the economy is not "uncertainty," or taxes, or budget concerns, or health care reform, or regulation. No. What is weighing the economy down, and what will continue to weigh the economy down, is bad debt that our policy makers are transfixed on making whole rather than restructuring. This will eventually happen, because it has to happen. Yet even with that expectation, it will be an extended process, and meanwhile, I believe that we'll have numerous opportunities to take constructive investment stances amidst it all. It's probably worth noting in passing that 1-year yields in Greece hit 40% last week, while 2-year yields are up to 30%. The can seems to be getting harder to kick. In case you haven't read the New York Times piece yet, I thought it would be appropriate to end with some comments from outgoing head of the FDIC, Sheila Bair (see Sheila Bair's Exit Interview ): On Bear Stearns: "Let's face it," she said. "Bear Stearns was a second-tier investment bank, with — what? — around $400 billion in assets? I'm a traditionalist. Banks and bank-holding companies are in the safety net. That's why they have deposit insurance. Investment banks take higher risks, and they are supposed to be outside the safety net. If they make enough mistakes, they are supposed to fail. So, yes, I was amazed when they saved it. I couldn't believe it. When they told me about it, I said: 'Guess what: Investment banks fail.' " On restructuring: By the spring of 2007, she was holding meetings with industry executives, pushing them to raise their lending standards and to restructure — that is, modify — abusive mortgages so homeowners wouldn't lose their homes when the housing bubble burst and large numbers of loans were bound to default. "There is nothing unusual about this," she told me. "Restructuring is one of the tools the banking industry has at its disposal." ... The banks, she says, "fought us tooth and nail." She lost. On bailouts: "Why did we do the bailouts?" she went on. "It was all about the bondholders," she said. "They did not want to impose losses on bondholders, and we did. We kept saying: 'There is no insurance premium on bondholders,' you know? For the little guy on Main Street who has bank deposits, we charge the banks a premium for that, and it gets passed on to the customer. We don't have the same thing for bondholders. They're supposed to take losses. What was it James Carville used to say?" Bair said. " 'When I die I want to come back as the bond market.' " --- The foregoing comments represent the general investment analysis and economic views of the Advisor, and are provided solely for the purpose of information, instruction and discourse. Prospectuses for the Hussman Strategic Growth Fund, the Hussman Strategic Total Return Fund, the Hussman Strategic International Fund, and the Hussman Strategic Dividend Value Fund, as well as Fund reports and other information, are available by clicking "The Funds" menu button from any page of this website. |
|||||||||||||||||||||||||
|
For more information about investing in the Hussman Funds, please call us at
1-800-HUSSMAN (1-800-487-7626) 513-326-3551 outside the United States Site and site contents © copyright Hussman Funds. Brief quotations including attribution and a direct link to this site (www.hussmanfunds.com) are authorized. All other rights reserved and actively enforced. Extensive or unattributed reproduction of text or research findings are violations of copyright law. Site design by 1WebsiteDesigners. |