|
|
||||||
|
|

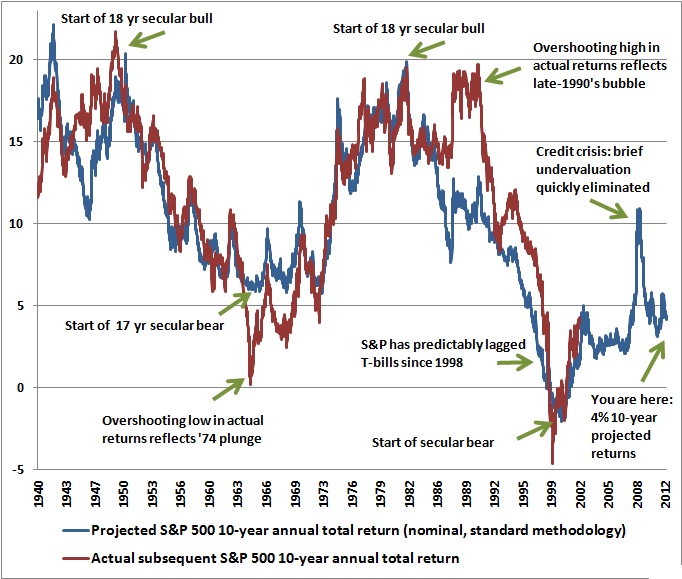
April 2, 2012 Too Little to "Lock In" We've regularly observed that corporate profit margins (and economy-wide, profits as a share of GDP) have a strong tendency to "mean revert" over time - specifically, elevated profit margins are associated with unusually weak earnings growth over the following 5-year period, and depressed profit margins are associated with unusually strong earnings growth over that horizon (see last week's comment, A False Sense of Security ). Notably, the ratio of corporate profits to GDP is presently nearly 70% above its historical norm. Of course, the most common valuation methods used by Wall Street analysts (whether they use the "Fed model" or "forward operating earnings times arbitrary P/E multiple") rely almost exclusively on estimates of year ahead earnings. Embedded in these toy models is the quiet assumption that current profit margins will be sustained indefinitely. By contrast, a wide range of measures that use "normalized" fundamentals of one form or another are extraordinarily stretched. Andrew Smithers recently took note of the elevated levels of cyclically adjusted P/E ratios and price to replacement cost ("q") and observed "As of 8th March, 2012, with the S&P 500 at 1365.9 , the overvaluation by the relevant measures was 48% for non-financials and 66% for quoted shares. Although the overvaluation of the stock market is well short of the extremes reached at the year ends of 1929 and 1999, it has reached the other previous peaks of 1906, 1936 and 1968." At 1400 on the S&P 500, the market's overvaluation has now reached 70% on these measures, which have a far stronger correlation with subsequent market returns than the Fed Model or other unadjusted methods using forward operating earnings. This is particularly true over horizons of 4 years or longer. As a side note, since the reliance on forward operating earnings is now an established Wall Street practice, Valuing the S&P 500 Using Forward Operating Earnings details how to improve the reliability of market valuations based on these figures. We presently estimate a nominal total return on the S&P 500 averaging 4.1% annually over the coming decade. This modestly exceeds the yield available on a 10-year Treasury, but by a small margin that - outside the late 1990's bubble period - has previously been seen only during the two-year period approaching the 1929 peak, between 1968-1972 (which was finally cleared by the 73-74 market plunge), and briefly in 1987, before the crash of that year. While it's true that interest rates are depressed, apparently setting a low "bar" for equities, an additional question one should ask is whether interest rates themselves are "fair" in the sense of being adequate compensation for long-horizon risks. For example, back in 1982, stocks had a reasonable 10-year prospective risk-premium versus bonds, but both were priced to achieve extraordinarily strong returns. Presently, stocks have a weak 10-year prospective risk-premium versus bonds, but both are priced to achieve unsatisfactory returns. In 1982, investors had an incentive to lock in either, and were served well regardless of their choice. At present, investors have no reasonable incentive at all to "lock in" the prospective returns implied by current prices of stocks or long-term bonds (though we suspect that 10-year Treasuries may benefit over a short horizon due to continued economic risks and still-unresolved debt concerns in Europe, which has already entered an economic downturn). It's also inadvisable to view the present 4.1% projected (nominal) 10-year return on the S&P 500 as if it is some sort of "yield," because even that expected return involves the risk of significant volatility and severe short-horizon loss. But don't low interest rates at least limit the potential downside in stocks, allowing stocks to remain at elevated valuations that are consistent with similarly low prospective returns? On that question, the historical record is instructive. Since 1930, the 10-year Treasury yield has been below 3% nearly 30% of the time. In 78% of those periods, the prospective 10-year total return on the S&P 500 exceeded 10% (based on our standard estimation method). In fact, the 10-year Treasury yield has historically been below 2.5% about 15% of the time (primarily in the period prior to 1952) and in fully 94% of those periods, the prospective 10-year total return on the S&P 500 exceeded 10%. The belief that prospective equity returns are tightly linked to bond yields is largely an artifact of the 1980-1998 period (when both enjoyed a persistent decline during a long period of disinflation), and is far less evident in broad market history. Ignore the fact that long-term "secular" bull market advances have invariably started from valuations implying prospective 10-year total returns of nearly 20% annually (which is precisely why the secular advances that follow are so durable). The market decline required to build in prospective returns of that magnitude seems too extreme to even contemplate. Indeed, we estimate that the S&P 500 would presently have to decline by nearly 40% simply to reach valuations consistent with prospective 10-year total returns of 10% annually. It's an open question whether we'll see that level of prospective return in the next market cycle, but even if we touch that level of prospective returns 5 or 6 years from now, stocks will have gone nowhere in the interim (including dividends). Investors would need to have a terribly short memory in order to rule out that sort of risk. Last week's valuation chart may be a useful reminder of where we stand relative to history.
On the subject of profit margins, James Montier at GMO published a nice piece last week, using a little-known national income identity (the Kalecki profits equation) to demonstrate that: Profits = Investment - Household Saving - Government Savings - Foreign Savings + Dividends Some might object that this is simply an identity (true by definition) and doesn't imply causality. That's a reasonable point, but as with all analysis, it's not enough just to toss out an objection and walk away - you've got to go to the data and find out the truth. So let's do that. We can actually simplify things a bit to make the point more intuitive. As we've shown before, gross private investment has a very strong relationship with the current account deficit ("foreign savings"). Specifically, large increases in gross private investment are almost invariably financed by running a trade deficit in goods and services, and importing foreign savings to make up the difference. Meanwhile, dividends tend to be very smooth, so they don't introduce a lot of variability to the equation. What remains then is a fairly simple assertion: the primary way to boost corporate profits to abnormally high - but unsustainable - levels is for the government and the household sector to both spend beyond their means at the same time. If we go to the data, we see the link between profit margins and deficits in the quarterly figures, but the tightest relationship is actually a causal one - large government deficits (as a percentage of GDP) coupled with weak household savings rates result in temporarily high corporate profit margins, with a lead of about 4-6 quarters.
The conclusion is straightforward. The hope for continued high profit margins really comes down to the hope that government and the household sector will both continue along unsustainable spending trajectories indefinitely. Conversely, any deleveraging of presently debt-heavy government and household balance sheets will predictably create a sustained retreat in corporate profit margins. With the ratio of corporate profits to GDP now about 70% above the historical norm, driven by a federal deficit in excess of 8% of GDP and a deeply depressed household saving rate, we view Wall Street's embedded assumption of a permanently high plateau in profit margins as myopic. [Geek's Note: If you think in terms of equilibrium in the associated real output (actual goods and services of one sort or another), the Kalecki equation also means that the deficit-financed goods and services are essentially already spoken for, so the resulting corporate profits are not matched by similar increases in real investment. Instead, corporations accumulate claims on the government and households (i.e. they acquire a pile of government and consumer debt obligations). These obligations can only be "spent" in aggregate by the corporate sector on investment goods once households and the government begin to release a "surplus" of output by saving instead of spending beyond their means. Either that, or the trade deficit would explode as corporations accumulated investment goods by transferring their claims on the U.S. government and households to foreigners.] A few quick economic notes. Real income declined month-over-month in the latest report, which is very much at odds with the job creation figures unless that job creation reflects extraordinarily low-paying jobs. Real disposable income growth has now dropped to just 0.3% year-over-year, which is lower than the rate that is typically observed even in recessions. Real personal consumption growth ticked up slightly from 1.6% to 1.8% year-over-year, remaining in a range that is rarely observed except in association with recession. Given the contraction in real income, we also saw a sharp downturn in the savings rate in the latest report, to the lowest level since just before the last recession. While the slight bump in consumption could help near-term corporate profits, the income dynamics aren't supportive of a continuation at all. Finally, we've been watching the new unemployment claims data for some time. Almost without fail, when a new number is released, the new claims figure for the previous week is revised upward by about 3000 or so. Last week, we saw an unusual revision in new claims data, not just for the previous week, but in months of prior releases, with upward revisions averaging about 10,000 in the most recent reports (e.g. the Feb 25 figure was revised from 354,000 to 373,000). This reflects an annual update in the seasonal factors used by the Labor Department (which is why the revisions weren't matched by similar changes in the non-seasonally adjusted data). It's not clear what this implies for revisions in the monthly employment figures, if anything, but our "unobserved components" models continue to suggest a general trend toward disappointments in economic data, particularly over the next 6-8 weeks. Given that so much investor enthusiasm has focused on the new claims figures, it's interesting that the large and generally upward revisions in months of prior data seemed to go virtually unnoticed. Market Climate As of last week, the Market Climate remained characterized by a hostile syndrome of overvalued, overbought, overbullish, rising-yield conditions. We've reviewed a variety of operational definitions of this syndrome in numerous prior weekly comments. Forget about the major declines that typically followed the handful of other instances we've observed this syndrome in the past, including the major peaks in 1972, 1987, 2000, and 2007. Even if we look over the past two years - and despite some early signals where market weakness was postponed by extraordinary monetary interventions - we still have not observed these conditions without resulting market declines of more than 15% (one in 2010 and another in 2011) that wiped out all of the gains since the earliest signal occurred, and then some. Monetary interventions can periodically fuel speculative runs, which defer and spread out the adjustments that result from persistent overvaluation and misallocation of capital. But they can't get around the inevitability of those adjustments. The only real choice policy makers have is how large a bubble they choose to see collapse. On that front, we're clearly in better shape than we were at the peaks of 2007, 2000 and 1929, but conditions are generally more hostile than they have been in the vast remainder of market history. This will change. By our analysis, now remains one of the worst times on record to assume that market risk is acceptable. Strategic Growth and Strategic International remain fully hedged. Strategic Dividend Value remains 50% hedged, its most defensive position, and Strategic Total Return continues to carry a duration of just under 3 years in Treasuries, with about 5% of assets allocated across precious metals shares, utilities, and foreign currencies. We don't view the prospective returns in any asset class as being desirable enough to "lock in" on an investment basis, which means that most financial risks here are essentially speculative, and rely on the emergence of investors willing to accept even lower prospective returns. Again, the one constant in the financial markets is that these conditions will change. Patient opportunism remains essential here. --- The foregoing comments represent the general investment analysis and economic views of the Advisor, and are provided solely for the purpose of information, instruction and discourse. Prospectuses for the Hussman Strategic Growth Fund, the Hussman Strategic Total Return Fund, the Hussman Strategic International Fund, and the Hussman Strategic Dividend Value Fund, as well as Fund reports and other information, are available by clicking "The Funds" menu button from any page of this website. |
|||||||||||||||||||||||||
|
For more information about investing in the Hussman Funds, please call us at
1-800-HUSSMAN (1-800-487-7626) 513-326-3551 outside the United States Site and site contents © copyright Hussman Funds. Brief quotations including attribution and a direct link to this site (www.hussmanfunds.com) are authorized. All other rights reserved and actively enforced. Extensive or unattributed reproduction of text or research findings are violations of copyright law. Site design by 1WebsiteDesigners. |