|
|
||||||
|
|

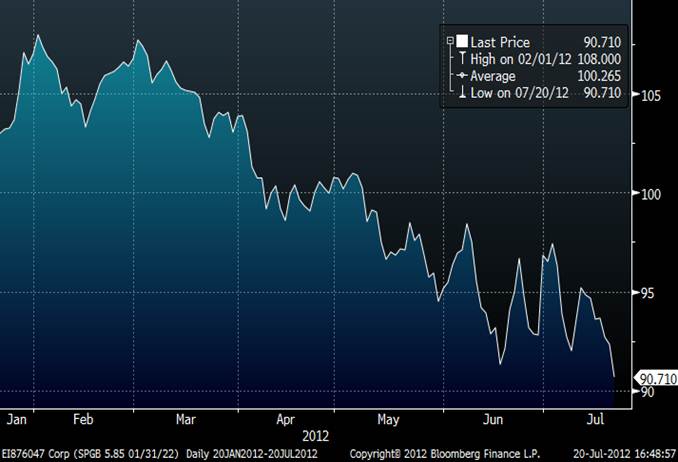
July 23, 2012 Extraordinary Strains Just weeks after the enthusiasm over Europe’s plan to plan for the possibility of using the European Stability Mechanism to bail out Spanish banks, the subtle technicality – that direct bailouts would make all of Europe’s citizens subordinate to even the unsecured bondholders of Spain’s banks – has predictably deflated that enthusiasm. On the growing recognition that addressing Spain’s banking problem will mean taking those banks into receivership, wiping out unsecured debt (much of which unfortunately was sold to unknowing Spanish savers as secure “savings” vehicles), and having the Spanish government sort out the damage, Spanish 10-year debt plunged to new lows last week (see chart below), and Spanish yields hit fresh Euro-crisis highs. At the same time, interest rates in Germany, Finland, Holland, Denmark and Switzerland all moved to negative levels looking 2-5 years out. The world is paying these governments to lend money to them, because the only way to acquire other default-free, non-commodity assets is to hire armored trucks and secure vaults to take delivery of physical currency. This set of conditions is not normal or sustainable, and indicates extreme credit market strains in Europe.
The Euro also hit a fresh 2-year low last week at 1.21, just a shade above its 2010 crisis low of 1.20. Likewise, the yield on 10-year U.S. Treasury bonds dropped to 1.45%, matching the historic low it reached a few weeks ago. Yields were higher even in the depths of the Great Depression, when the S&P 500 was trading at less than 2 times the pre-Depression level of earnings, the Shiller P/E (S&P 500 divided by the 10-year average of inflation-adjusted earnings) was less than 5, and the S&P 500 was yielding 16%. As a side note, many analysts seem almost woozy at the “incredible value” that supposedly exists in stocks because the 2.3% yield on the S&P 500 exceeds the 1.45% yield on 10-year Treasuries. It’s worth pointing out that prior to the point that inflation took off after 1960, the yield on the S&P 500 exceeded the yield on Treasury bonds in fully 93% of the data. Keep in mind that once you subtract out the necessary compensation for default risk (which is rapidly increasing in Spain, for example), interest rates represent the value that the economy places on time. Long-term interest rates have plunged to record lows, and real interest rates are negative after inflation. What interest rates are telling you; what the Federal Reserve is telling you; what the equilibrium created by lenders and borrowers is telling you – is that time is economically worthless and that economic malaise will extend for years. This does not reflect a well-functioning economy. To the contrary, if you look across history and across nations, strong prospects for sustained economic growth are typically accompanied by high real interest rates, because the demand for capital is robust and good ideas have to compete for funding. Interest rates are an indication of both the demand for loans and the incentive to save. It is not “stimulative” to depress interest rates in an environment where households, businesses and governments are desperately trying to reduce debt. That policy may insult the value of time enough to deter people from saving, and to reduce the immediate penalty for assuming even larger amounts of debt (as the U.S. government continues to do), but it should be clear that these actions move the economy further from a sustainable equilibrium, not closer to it. I do expect that it will be possible to navigate the coming years well, but it will not be by locking in negligible yields and depressed risk premiums in the futile hope that one plus one will end up being something other than two. Prospective returns vary a great deal over the course of the market cycle, and the strategy of varying risk exposure in proportion to the prospective compensation for that risk will be essential. On the economic front, as we expected based on leading economic evidence, new orders and order backlogs have dropped abruptly in recent reports. These indices are short-leading indicators of production, which is likely to show a striking decline beginning in the July data. Note carefully whether any positive surprises are in May and June data, because these reports will still be mixed. I continue to expect negative employment changes in the coming months, though as I’ve noted before, we may only find this out later on revisions rather than the initial prints in real-time. In any event, I am convinced that we will ultimately learn that the U.S. economy, slightly trailing the global economy, entered a new recession in June. While July components are still coming in, the chart below shows the most recent condition of coincident U.S. economic data, reflecting a variety of Fed surveys and Purchasing Managers surveys.
The key question - in view of extreme credit market strains in Europe, and accelerating economic deterioration in the U.S. – is why the S&P 500 continues to trade within a few percent of its April bull market high. The answer is simple: investors are scared to death of missing the widely anticipated market advance that they expect to follow a widely anticipated third round of quantitative easing. Good economic news may be a relief for investors, but bad economic news in this context is just as much of a relief because it brings forward the anticipated delivery date of the sugar. The follow-up question, however, is that if more QE is widely anticipated, and a market advance is widely anticipated to result, isn’t that the precise definition of an event that is already priced into the market? If you look at the Federal Reserve’s own research on quantitative easing – large scale asset purchases (LSAPs) – nearly every paper emphasizes the “portfolio balance” effect. Put simply, as the Fed removes longer-term Treasury securities from the menu of portfolio choices available to investors, it forces investors to consider alternative securities, raising their prices and lowering their yields – with a particular impact in driving down the risk premiums of risky securities. Indeed, as we’ve noted, QE has generally been effective in helping stocks to recover the peak-to-trough loss that they have suffered in the prior 6-month period (though the most recent LSAPs in the UK and Europe have been failures in that regard). Still, once risk premiums are already deeply depressed (we estimate the likely 10-year prospective total nominal return for the S&P 500 to be only 4.8% annually), once stocks are trading near their bull market highs, and once Treasury debt already sports the lowest yield in history, should investors really expect much of a portfolio-balance effect from further attempts at QE? Frankly, I doubt it, but in the eventuality of a third round of QE, we’ll focus on our own measures of market action – not on any blind faith in the Fed. The more troubling issue is that Fed papers on the effectiveness of QE focus almost singularly on the effect of QE on interest rates and risk premiums in the financial markets, with the notable absence of any analysis of the resulting effect on the real economy. This is like showing that squirting gas into an engine will make the engine run faster, without any concern for the fact that there is no transmission that connects the engine to the wheels. In a nutshell, the problem with QE is the lack of any material transmission mechanism from monetary interventions to real economic activity. This is a problem that the Fed should have recognized years ago, because there is strong and consistent historical evidence that real economic activity has very weak “elasticity” with respect to financial market fluctuations, particularly in equity values. Invariably, a 1% change in the value of the stock market is associated with a change of just 0.03-0.05% in GDP, and even that change is transitory. What the Fed has been doing is little but bubble-blowing, while at the same time driving the global financial system further from equilibrium rather than toward it. Unfortunately, I expect these efforts to continue, but I also expect that it will be useless in averting an unfolding global recession. If the Fed was to initiate a third round of QE near present levels, it would likely be disappointing in the sense that it would fail to reverse economic weakness and at the same time would fail to drive equity prices higher than they already are, or interest rates materially lower than they already are. This would damage confidence in the Federal Reserve and force it to resort to language about monetary policy working with “long and variable lags.” Moreover, at a 1.45% yield and an 8-year duration on a 10-year bond, any interest rate increase of more than about 18 basis points a year will now produce a negative total return for the Federal Reserve over the period that the bonds are held, which comes at public expense (reducing the amount of interest that the Fed would otherwise turn over to the Treasury). As a result, talk is presently much cheaper than action. It seems likely that another round of QE will await obvious economic weakness and a significant spike in risk premiums – probably best measured by the depth of the drawdown in the S&P 500 from its most recent 6-month peak. Still, given that the rationale for much higher risk premiums is very real, it’s not clear that QE will have durable effects on stocks even in that event. In short, a broad array of observable evidence suggests extraordinary strains in Europe, and abrupt though expected deterioration in U.S. economic activity. The Federal Reserve certainly has policy options, but those options have no material transmission mechanism to the real economy. We’ve always viewed the Federal Reserve as having an important and legitimate role in providing liquidity to the banking system in the event of heavy withdrawals; creating new reserves in return for high-quality, default-free securities backed by the full faith and credit of the U.S. government. This remains an important role, but the Fed’s actions have gone far beyond this role into areas that distort financial markets without transmission to economic activity. That’s just a reality we have to accept, and we’ll respond to further interventions with particular attention to trend-following measures of market action. Here and now, we remain defensive in the face of accelerating strains the global economy – new highs in Spanish yields, negative interest rates across more stable European countries, new lows in the Euro and U.S. Treasury yields, collapsing new orders and backlogs, a sudden plunge in the employment component of the Philly Fed index, collapsing M2 velocity, and other factors. Due to some modest interest-rate considerations, our estimates of prospective return/risk have improved negligibly from the most negative 0.5% of historical observations, and are now among the most negative 0.8% of historical data. This rare extreme keeps us on red alert for now. Market Climate As noted above, accelerating strains are evident both in the global economy – particularly Europe – and in the U.S. economy. Stock valuations remain stretched on the basis of normalized earnings. Profit margins are nearly 70% above their historical norms at present, but these margins reflect very high deficit spending and very weak savings rates – something that can be related to corporate profit margins through accounting identities. Unless one anticipates continued deficits indefinitely, either revenues will revert closer to the level of labor compensation, or less likely, labor compensation will increase toward the level of revenues, but in any event the gap will tend to narrow. This may not be an immediate outcome, but stocks are instruments with an effective duration of over 40 years (mathematically, the duration of stocks is essentially equal to the price-dividend ratio, regardless of growth rates or repurchases). The very long-term stream of cash flows matters enormously in asset valuation. One of the immediate issues I have with stocks here is the “exhaustion syndrome” (see Goat Rodeo) that has re-emerged in recent weeks. Examining the rare past instances of this syndrome, in 1961, 1987, 2000, and early-2008 among others, the key feature is a breakdown in measures of market action from an overvalued, overbought extreme, followed by a recovery rally toward the prior high and accompanied by earnings yields below their level of 6-months earlier, and overbullish advisory sentiment - either advisory bulls above 45% or advisory bears below 30%. Normally, the recovery carries the market back to the prior “line” of support that surrounds the peak. The emergence of this exhaustion syndrome may seem benign or unimportant, but it has historically been an important precursor of major market declines. Given what are already significant challenges for both the economy and for the prospective return/risk tradeoff in stocks, my concerns about the potential for deep market losses remain elevated. Investors often have the impression that the market simply collapses once a bull market peak is set, but this isn’t typical. What is typical is exactly the sort of pattern we’ve observed since April. To illustrate this, the chart below presents market behavior around several market peaks that were also followed by an exhaustion syndrome as we observe today. The bull market peaks are aligned at 1.0. The remaining scale is set as a fraction of that peak. Time is measured in trading days before and after the bull market peak. Note that after a quick initial decline from the bull market peak, it’s typical for the market to recover much of the lost ground before the downside progress continues, in some cases producing the syndrome that we presently observe. That said, the past performance of the market is not indicative of future results, and the behavior of the S&P 500 in these prior market cycles is not an assurance of what we will observe in the present instance.
Exhaustion syndromes can go on for several weeks, but have historically been very dangerous advances to trade, because more often than not, there is a bear market just behind them. Corrections on a smaller scale than a bear market followed the July 1998 instance – a decline of only 18%, and the July 1999 instance – down only 12% over the next several months. There were three instances of this syndrome that were not associated with a market plunge: January 2006 during the housing bubble (which ultimately led to a market collapse well below those levels), November 2010, just as the Fed was initiating QE2 (which still did not prevent the market from trading at lower levels about 9 months later), and of course the instance in late January of this year, which occurred at about 1326 on the S&P 500 and still hasn’t yet resolved into losses beyond the weakness we saw in May. Still, the median decline across all instances exceeds a 20% market loss within 7 months, and the average is worse. It’s possible that the market outcome will be benign in this case, and that the market will go on to set further bull market highs. We have no intention of taking that improbable gamble in the face of present headwinds. Strategic Growth and Strategic International continue to be fully hedged, with a staggered-strike option position in Strategic Growth (which raises the strike prices of the put side of our hedge). We presently estimate the time-decay or “theta” of the staggered-strike position at about 0.25% of assets monthly – which we are willing to accept based on the extremely negative outcomes that are typical of the current climate, and the expectation that we will not remain in this position for a long time. Strategic Dividend Value is hedged at about 50% of the value of its stock holdings, and Strategic Total Return continues to carry a duration of just over one year, with about 10% of assets in precious metals shares and a few percent of assets in utility shares and foreign currencies. --- The foregoing comments represent the general investment analysis and economic views of the Advisor, and are provided solely for the purpose of information, instruction and discourse. Prospectuses for the Hussman Strategic Growth Fund, the Hussman Strategic Total Return Fund, the Hussman Strategic International Fund, and the Hussman Strategic Dividend Value Fund, as well as Fund reports and other information, are available by clicking "The Funds" menu button from any page of this website. |
|||||||||||||||||||||||||
|
For more information about investing in the Hussman Funds, please call us at
1-800-HUSSMAN (1-800-487-7626) 513-326-3551 outside the United States Site and site contents © copyright Hussman Funds. Brief quotations including attribution and a direct link to this site (www.hussmanfunds.com) are authorized. All other rights reserved and actively enforced. Extensive or unattributed reproduction of text or research findings are violations of copyright law. Site design by 1WebsiteDesigners. |