|
|
||||||
|
|

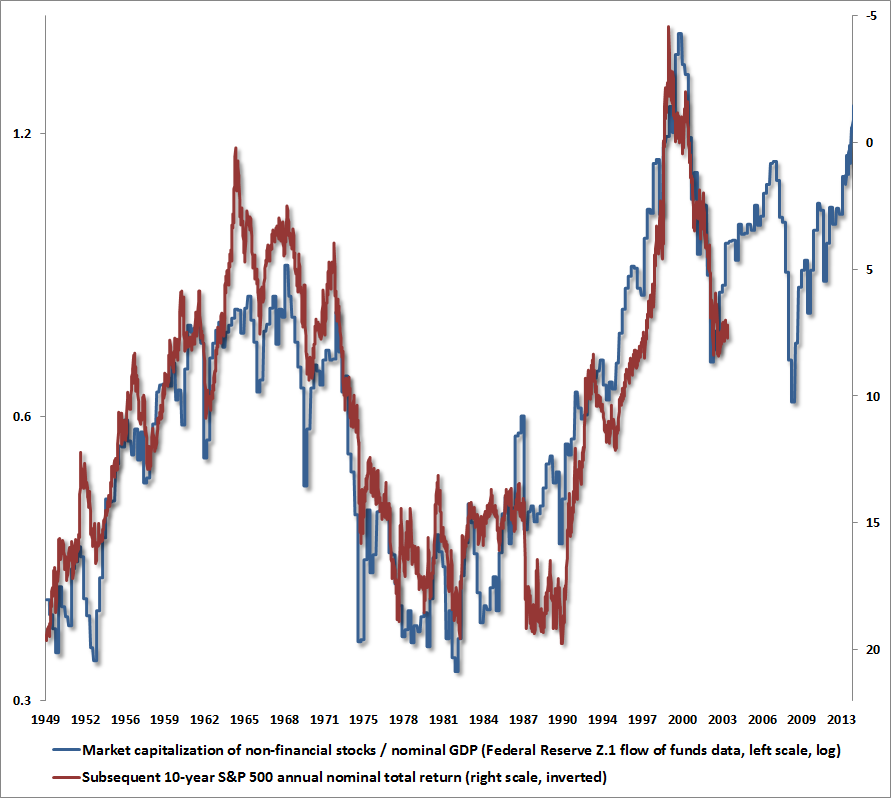
December 9, 2013 The Truth Does Not Change According To Our Ability To Stomach It Our estimate of prospective 10-year nominal S&P 500 total returns has eroded to just 2.3%, suggesting that equities are likely to underperform even the relatively low returns available on 10-year Treasury bonds in the coming decade. Those estimates have had a correlation of over 85% with subsequent 10-year S&P 500 total returns since 1940, and a higher correlation with subsequent returns more recently. We don’t rely on any single estimation method, and some are more complex discounting models, but a number of very good shorthand methods with similar historical reliability are reviewed in the Valuation section of Investment, Speculation, Valuation, and Tinker Bell. Note that these same valuation measures were quite favorable in 2009, and gave us sufficient room to shift to a constructive stance after the 2000-2002 bear market plunge, while warning of overvaluation at the 2000, 2007 and present instances. Despite other considerations that have been unique to this cycle, our valuation measures haven’t missed a beat. As a side-note, it’s easy enough to evaluate the all of these methods versus actual subsequent equity returns in a century of historical data. One can demonstrate their reliability against alternatives such as the Fed Model, “equity risk premium” models, and forward-operating P/E ratios (see An Open Letter to the Fed: Recognizing the Valuation Bubble in Equities), as well as measures that use NIPA profits (where a rather egregious bit of analysis that I addressed months ago continues to stagger about like the living dead). Analysts who don’t show their data, and more importantly, don’t demonstrate that their valuation methods are tightly correlated with actual subsequent market returns over the next several years, are simply purveyors of noise. When you realize that the errors of the Fed Model in explaining actual subsequent market returns (in excess of bonds) are 86% correlated with the profit margins that existed at the time of the forecast, it should be clear that the model is not capturing regularities that ought to be captured. Examining extreme market peaks across history, you’ll usually observe three things: a) the most historically reliable valuation measures will have modestly underestimated the advance over the preceding 10-years, b) those same valuation measures will be projecting dismal subsequent market returns, and c) those valuation measures will be proven right. The converse is generally true at extreme market troughs (see The Siren’s Song of the Unfinished Half-Cycle for a historical graph that illustrates these regularities). The reason for this is that any market extreme is the endpoint of an unfinished half-cycle. So not surprisingly, when we examine projections from a decade ago, or calculate a 13+year estimate from the 2000 peak, the S&P 500 has briefly outperformed those estimates by several percent annually. These “overshoots” are likely to be corrected in the completion of the full market cycle. The stock market is presently at valuations where not only cyclical but secular bear markets have started. A secular bear period comprises a series of cyclical bull-bear periods where valuations gradually work their way lower at each successive cyclical trough. The past 13 years of paltry overall total returns for the S&P 500 have unfortunately corrected very little of the excess in 2000, largely thanks to yet another round of Fed-enabled speculation. We should have learned how these episodes end. At least in 2000 investors had not seen that ending, and even in 2007, the point had not been driven home. There is no excuse today, at least not if one distinguishes between measures that have provided reliable guidance about actual subsequent market returns over the past century, and those that - despite their popular appeal - have not. Though valuations for the S&P 500 are not as rich as 2000 on most measures, valuations for the median stock actually exceed the 2000 peak. From the standpoint of a century of market history, equity valuations are obscene. I fully understand that investors would like to believe 13 years after the 2000 bubble peak (during which time the S&P 500 has achieved annual total returns of scarcely 3% annually) it should be impossible that stocks could be in yet another valuation bubble. Explaining this unfortunate situation to my 17-year old daughter, she quotes Flannery O’Connor - “The truth does not change according to our ability to stomach it.” The S&P 500 was priced in 2000 to achieve what we estimated to be negative total returns over the following decade, and the market did exactly that. But today, a few years past that 10-year mark, the 3% annual total return of the market since 2000 has been achieved only by restoring historically severe valuations. Again, present valuations are less severe than in 2000 for the S&P 500 as a whole, but are actually more severe for the median stock. In 2000, small capitalization stocks were much better valued than larger ones, though that didn’t prevent them from losing a large portion of their value in the bear market that followed. What we observe today is very broad based overvaluation across asset classes and individual securities. This is why measures that extend beyond the S&P 500 – like the market capitalization of equities / GDP (based on Federal Reserve Z.1 Flow of Funds data) are worse than in 2007 and are approaching the records seen in 2000. It’s why the median price/revenue ratio for S&P 500 stocks is now higher than at the 2000 peak (and is nearly as high if one uses enterprise value/revenue instead of price/revenue). It’s why Value Line now reports the lowest median 3-5 year appreciation potential among all of the stocks it covers - lower than 2000 and 2007, and every point back to the 1960’s.
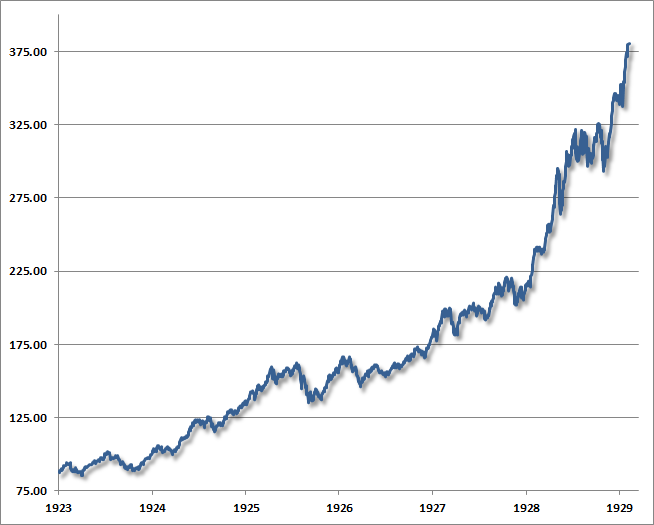
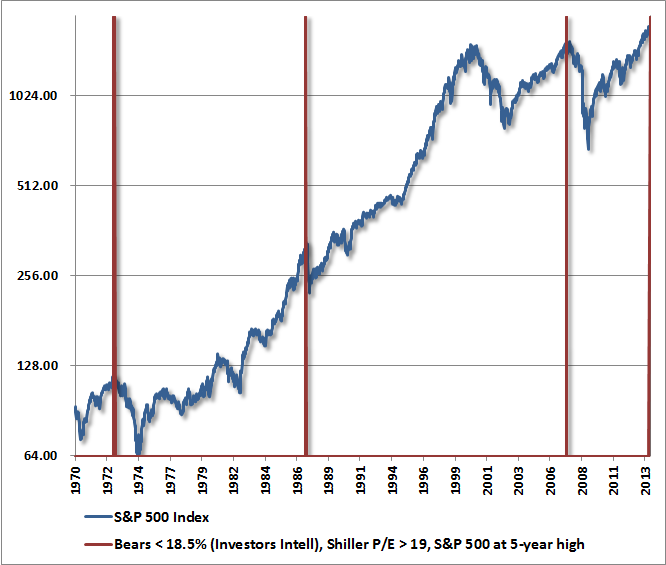
Since 2012, a combination of enthusiasm, superstition and blind faith in quantitative easing has clearly allowed the market to climb a speculative parabola even in the face of extreme overvalued, overbought, overbullish conditions that have historically resolved much more quickly. I continue to believe that this is not a reflection of any permanent change in market dynamics, but is instead a temporary reprieve from consequences that will be even worse for the wait. The median is not the messenger The knee-jerk reaction to the fact that the median stock is now more overvalued than in 2000, and that prospective 10-year S&P 500 returns are dismal, is to dispense with the evidence because of our own challenges since 2009. I cannot emphasize strongly enough that those challenges trace primarily to the stress-testing decision that I made in 2009, even though our existing methods had enjoyed an outstanding record at that point. Moreover, the methods that resulted would have outperformed our pre-2009 methods both in historical data and in the recent cycle, had they been available at the time. I fully accept that missed returns in the half-cycle since 2009 will keep me open to criticism until we prove all of this out over the completion of this cycle and future ones. Meanwhile, however, I fear that investors are going to do themselves a terrible disservice if they ignore the objective evidence on the basis of our subjective miss, or if they fail to distinguish the past year – a sustained period of overvalued, overbought, overbullish conditions that have always resulted in subsequent collapses that wipe out a significant fraction of the market’s value – from that stress testing decision. Understanding this narrative admittedly doesn’t make the half-cycle since 2009 less disappointing, but we can evaluate the resulting methods in a century of market cycles across history, including the most recent ones. Our confidence in their ability to navigate the completion of this cycle, and those in the future, isn't dimmed by the awkward transition that resulted from my insistence on stress-testing in 2009. Everything looks easy in hindsight. At the end of every episode of “Deal or No Deal,” Howie Mandel asks the contestant to call out the numbers of the remaining unopened briefcases, to see whether the contestant had the million-dollar briefcase all along. It’s always fascinating that people judge whether a contestant “made a good deal” depending on how far they might have pushed their luck before losing everything. This is precisely what investors are doing here. They fear the regret of getting out with what is already a good deal because they might get more if they keep pushing their luck. One might get away with that strategy in a one-time game of “Deal or No Deal,” but in a repeated game, it’s a terrible approach. Investors should have discovered this during the 50% plunges following the 2000 and 2007 peaks, but they have again decided that “this time is different.” Without the benefit of hindsight, one has to weigh the relevant evidence at hand. The simple reason for my stress-testing decision is that 2008-early 2009 outcomes were dramatically “out of sample” from the standpoint of the methods we had exhaustively tested only in post-war evidence since 1940. The economic and market outcomes were much more similar in scale to what was observed in Depression-era data. The same valuations we observed in early 2009 were followed, in the Depression, by a further two-thirds loss in the value of the stock market. Though the stock market corrected its 1929 plunge by briefly advancing nearly 50% in the early months of 1930, the gains were largely given back within three months, and the market went on to lose about 80% of its value from that 1930 post-crash high (more than 85% from the 1929 high). In any event, we no longer face anything close to the valuations that existed in 2009. At that time, we could at least say that the prospective 10-year nominal total return for the S&P 500 exceeded 10% annually. Today, we estimate prospective S&P 500 total returns at just 2.3% annually for the coming decade. Stocks have already enjoyed a 5-year half-cycle that correlates most strongly – among all periods in history – with the advances preceding the 1929, 2000 and 2007 market peaks (no surprise – unbroken diagonal lines always correlate strongly). After sustained market advances, investors are inclined to look at market returns in the rear-view mirror, using phrases like “the market is paying X% a year” as if the past is prologue. Looking at the chart of the Dow Jones Industrial Average approaching the peak from which it was soon to lose seven-eighths of its value, does anyone believe that investors then were any less confident about an “unbreakable” market than investors are now? Signs of a speculative peak Last week, the percentage of bearish investment advisors plunged to just 14.3%, the lowest level in 25+ years. The Shiller P/E (the S&P 500 Index divided by the 10-year average of inflation-adjusted earnings) is now 25.4, and while we use the Shiller only as a readily-available shorthand for other measures, it is certainly better correlated with our actual valuation measures than alternatives like the Fed Model are. Looking over the historical record, the only other instance that bearish sentiment was this low while the Shiller P/E was over 19 was the exact peak of the S&P 500 in January 1973, before the market lost half its value. Looking at the overvalued, overbought, overbullish features that regularly define market peaks, there are only four instances in history when the Shiller P/E was over 19, the market was at a 5-year high, and bearish sentiment was anywhere below 18.5%. These instances were 1972, 1987, 2007, and today. The 2000 peak doesn’t appear because bearish sentiment never moved below 20% that year.
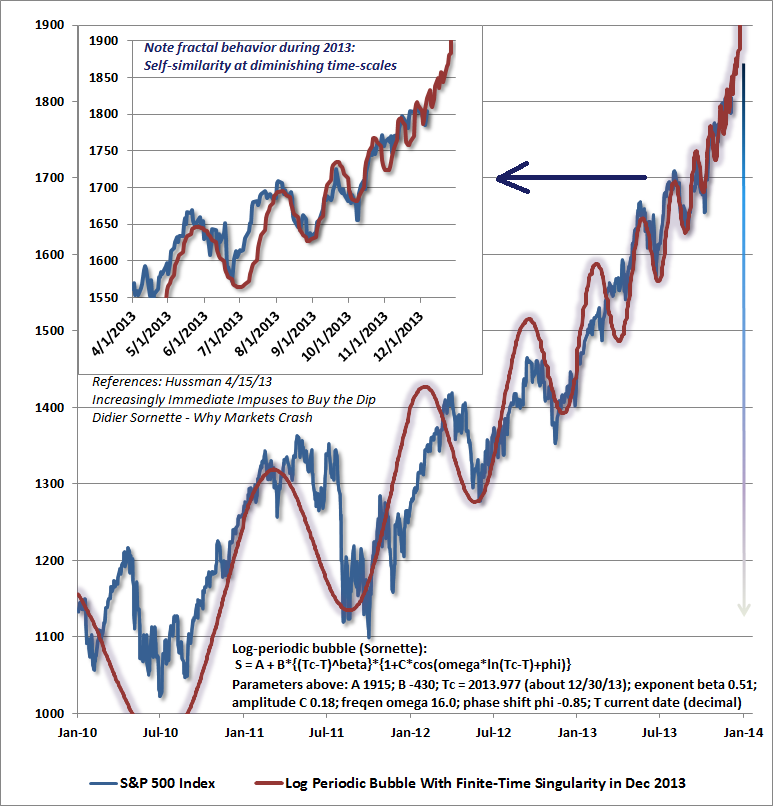
Among the litany of other classic features of a speculative bull market peak, margin debt on the NYSE has surged to the highest level in history, and at nearly 2.5% of GDP, exceeds all but two months in 2000 and 2007. The amount being borrowed to buy stocks on margin is now 26% the size of all commercial and industrial loans in the entire U.S. banking sector. As low-quality, high-risk borrowers rush to take advantage of the present speculative appetite, issuance of leveraged loans (particularly the junkier “covenant-lite” forms) has now hit a record high, already eclipsing the previous record in 2007 at the height of pre-crisis yield-seeking. New equity issuance is also running at the fastest pace since any point except the 2000 bubble peak. At the same time, Bloomberg reports that investors are plowing more into stock mutual funds than at any point since the 2000 bubble peak. Keep in mind how this works - every buyer is matched with a seller in equilibrium, so the same amount of stock is being sold by institutions and other non-retail investors. One doesn’t need to think long to answer who is likely to be the “smart money” in this trade, as the history of surges in retail participation provides a rather firm answer to that question. Meanwhile, Value Line’s “Median 3-5 Year Appreciation Potential” for the stocks it covers is now the lowest since the 1960’s. Statistically, if one subtracts about 55% from the VLMAP, the result approximates the actual subsequent 4-year total return of the S&P 500. At a VLMAP of just 30%, the implication is a loss, in total return, of about -25% in the S&P 500 over the coming 4-year period. While my impression is that the market is likely to experience an even deeper interim loss, a 4-year overall market loss of -25%, followed by positive 9% average annual total returns for the S&P 500 over the subsequent 6-year period, would compound to produce a 10-year total return averaging 2.3%. That’s right in line with estimates from our own methods. Still, there is good news in that calculation: just because 10-year prospects are dismal at present doesn't necessarily mean that investors will need to be defensive for the next 10 years. I expect that we'll see much more attractive investment opportunities far sooner than that. In any event, when the books are closed on the next decade, we expect realized total returns on the S&P 500 to be even less than the depressed yield-to-maturity on 10-year Treasury bonds, with steep interim losses for stocks along the way. On the subject of risk, aside from statistical measures like standard deviation, one of the ways to gauge potential price risk is to estimate what’s called “duration” – which is the sensitivity of price to a 100 basis point change in the rate used to discount future cash flows to present value. Duration is also a measure of the weighted-average date at which those discounted cash flows will be received. For a 10-year bond, duration stands at about 9 years at present (mostly influenced by the size of the lump-sum principal payment relative to the periodic interest payments), while the duration of the S&P 500 stands at about 50 years. Of course, 10-year bond yields are more volatile than the implied discount rate on equities (something that the Fed Model doesn’t contemplate because its users don’t even think in terms of long-term cash flows), but because equity durations are so high, stocks are likely to have several times the volatility and several times deeper drawdowns than bonds. So passive buy-and-hold investors – who lock in a price and don’t alter their investment positions for a long period of time – should recognize that Treasury bonds are likely to outperform stocks over the coming decade, with substantially less risk. In my view, neither asset class is attractively priced, but in a world of zero returns on Treasury bills, our risk budget for passive investors would lean more toward bonds than equities here nonetheless. Bubble notes All of this said, momentum and speculation continue to drive short-term outcomes, and valuation has very little near-term effect on that. It’s always problematic to gauge the endpoint of a parabolic advance, because very small changes in that endpoint can represent significant differences in price (see the chart above of the advance to the 1929 peak for a nice example of this). The gains tend to be surrendered very quickly after those peaks, though often with recovery attempts before severe losses follow. Any discussion about short-term market outcomes relies more on “impressions” and “tendencies” than reliable estimates. My impression is that the present advance remains consistent with a Sornette-type bubble that may have a bit of speculative reverie left in it. The basic characteristic of a Sornette bubble is a “log periodic” pattern where market declines become progressively shallower and more frequent. I’ve described the investment behavior that drives this dynamic in terms of “increasingly immediate impulses to buy the dip.” What we’ve got now is a rather extreme version of this tendency, where nearly every pullback is seen as an opportunity. We’ve been asked why the bubble appears to start in 2010 instead of at the 2009 low. The reason is that the advance from the 2009 low and into early 2010 was a legitimate non-bubble advance from a historically reasonable valuation to a historically elevated one. In the third-quarter of 2010, the Fed set a bubble in motion by encouraging the largely superstitious but – at least in the intermediate term – self-fulfilling belief in a central bank “backstop” against market risk. That’s when market dynamics shifted from investment to increasingly frantic speculation that has produced what are now historically obscene valuations. We should not rely, but should allow for the tendency to buy every dip to move to an even more frantic pitch in the weeks ahead. In the chart below, I’ve enlarged the segment from recent months as a separate inset. Notice that log-periodic bubbles are “fractal” in that smaller segments are similar to larger segments. It will be important to watch for the emergence of fractal self-similarity at the smallest time-scales, which sometimes presents itself as increasing volatility even at 10-minute intervals (a characteristic I also noted at the 2007 peak, and again just before the market collapsed in 2008 – see Nervous Bunny). Remember, however, that this sort of fevered pitch is also terribly impermanent. We vividly recall the seeming “relentlessness” and “resilience” of the market approaching the 2000 and 2007 peaks. Investors must have felt nearly the same as prices approached their peak in 1929.
The foregoing comments represent the general investment analysis and economic views of the Advisor, and are provided solely for the purpose of information, instruction and discourse. Only comments in the Fund Notes section relate specifically to the Hussman Funds and the investment positions of the Funds. Fund Notes As of last week, Strategic Growth Fund remained fully hedged, with a “staggered strike” position that sets the strike prices of most of its index put options a few percent below present market levels. The Fund also carries a small position in index call options, still amounting to a fraction of one percent of Fund assets. A short-term speculative blowoff would bring those call options “in-the-money”, while a sideways or down market would result in a fraction of a percent in premium decay. Given the very well-defined speculative window that we believe is consistent with a blowoff, coupled with inability to rely on that sort of outcome in the presence of severely overvalued, overbought, overbullish conditions already, we view very small call option exposures as an appropriate contingency in the context of what otherwise remains a strongly defensive investment stance. One of the most dangerous habits in the investment world is to phrase a past return as a future one, by adding the suffix “ing.” At market peaks, many investors don't simply acknowledge that the market has returned X% annually over some recent period. Instead, they say that the market is returning X% annually (or worse, is “paying” X% annually). Likewise, at market bottoms, they say that the market is losing X% annually. The same practice extends to other asset classes like bonds, and to individual securities. This tendency to invest by hindsight leads investors to look at their portfolios and load them with asset classes and securities that seem to be “returning” or “paying” most. It is a recipe that leads investors to hold terribly aggressive portfolios at market peaks, and overly defensive portfolios at market lows. Whether or not readers own the Hussman Funds, my hope in these weekly comments is to discourage those tendencies, and encourage investors to evaluate their investments on a prospective basis. I have no intention to discourage investors following a passive, disciplined buy-and-hold strategy from maintaining their discipline, provided that their allocations reasonably align the duration of their investments with the expected date that they’ll need the funds. At current interest rates, the duration of bonds is not much different from their maturity, since the terminal face value payment dominates the effect of interest payments. For example, a 10-year Treasury bond has a duration of about 9 years. By contrast, provided that dividends per share (which capture the effect of stock buybacks) grow fairly smoothly over time, and current dividends are more or less “representative,” the duration of stocks mathematically works out to be roughly the price/dividend ratio. So the effective duration of the S&P 500 presently works out to about 50 years. Passive investors who are indifferent to valuations and long-term prospective returns are still encouraged to reasonably align the total duration of their equity and bond exposures with the expected duration of their lifetime spending liabilities. Strategic International remains fully hedged. Strategic Dividend Value is hedged at about 50% of the value of its stock holdings. In Strategic Total Return, we clipped the Fund’s duration back to about 3.5 years earlier in the week (meaning that a 100 basis point increase in interest rates would be expected to impact Fund value by about 3.5% on the basis of bond price fluctuations), while increasing the Fund’s holdings in precious metals shares to about 8% of Fund assets on price weakness in that sector. Our general view is that the Treasury yield curve is much steeper than we expect to endure, but against that, unfavorable yield pressures – on economic hopes that I see as unconvincing but exist in any event – may at least briefly lean against the tendency of the curve to normalize. Those two general considerations drive a moderate but not aggressive expected return/risk profile in bonds, and we are positioned accordingly.
--- The foregoing comments represent the general investment analysis and economic views of the Advisor, and are provided solely for the purpose of information, instruction and discourse. Prospectuses for the Hussman Strategic Growth Fund, the Hussman Strategic Total Return Fund, the Hussman Strategic International Fund, and the Hussman Strategic Dividend Value Fund, as well as Fund reports and other information, are available by clicking "The Funds" menu button from any page of this website. |
|||||||||||||||||||||||||
|
For more information about investing in the Hussman Funds, please call us at
1-800-HUSSMAN (1-800-487-7626) 513-326-3551 outside the United States Site and site contents © copyright Hussman Funds. Brief quotations including attribution and a direct link to this site (www.hussmanfunds.com) are authorized. All other rights reserved and actively enforced. Extensive or unattributed reproduction of text or research findings are violations of copyright law. Site design by 1WebsiteDesigners. |