|
|
||||||
|
|

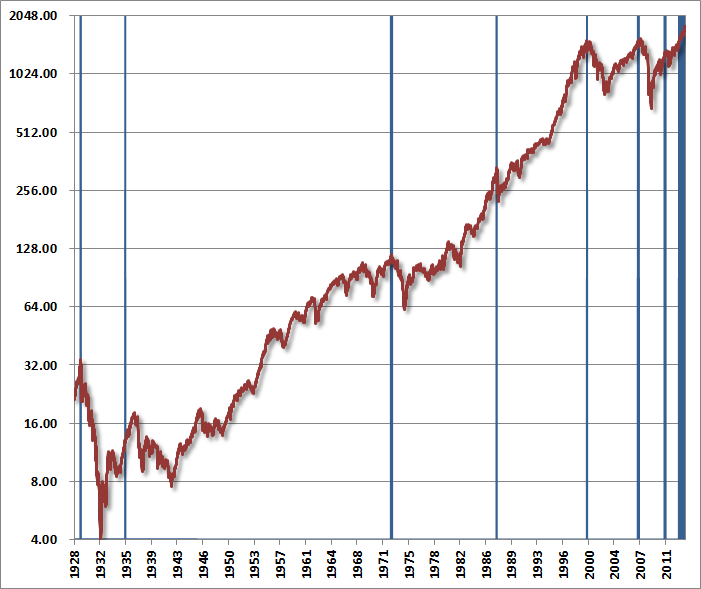
December 23, 2013 The Diva is Already Singing A note on evidence-based investment discipline: It will come as no surprise that we continue to encourage a patient, historically-informed strategy that aligns our investment stance with the estimated return/risk profile of the market at each point in time. A century of evidence demonstrates the effectiveness of this discipline both from the standpoint of return versus a passive investment approach, and from the standpoint of diminished risk. Yet this is also a discipline that has been decidedly wrong more recently. We have some explaining to do. Part of a good investment discipline is, and must be, to constantly seek improvements and address challenges. But part of a good investment discipline is also to recognize those points where discomfort is an unpleasant necessity. An “improvement” that might ease discomfort by reversing our presently defensive stance, but that would have left investors vulnerable to the deepest market losses on record, is no improvement at all. We tolerate the frustration of remaining defensive during this speculative advance because it shares hallmarks that were shortly followed by the most punishing market losses in history. The fact that a similar consequence has been deferred in this instance does not convince us that it has been avoided. It’s important to understand why we so adamantly adhere to our approach, having missed not only recent gains, but larger gains since 2009. The reason is simple: a significant portion of our miss in this cycle traces to what I view as a necessary stress-testing decision in 2009 that had the very unfortunate effect of foregoing returns that either our pre-2009 methods or our present methods could have captured. I’ll leave the fine points of this to prior commentaries of recent years, as I’m told that I make this distinction too often. I actually doubt that’s possible. The stakes of failing to understand this distinction are far too high – particularly now. As I’ve frequently noted, the most dangerous points to embrace risk are typically when a syndrome of overvalued, overbought, overbullish conditions emerges. In contrast, the most favorable points to embrace market risk typically occur when a moderate-to-severe retreat in valuations is followed by an early improvement in market action, as measured across a broad range of market internals (an opportunity that we easily accepted in early 2003 after the 2000-2002 bear market). The benefit of these considerations is straightforward to demonstrate in numerous complete market cycles across history, even using very simplistic factors – see Aligning Market Exposure with the Expected Return/Risk Profile. We can examine the recent market cycle (bull-peak to bull-peak since 2007) both from the standpoint of the methods that we successfully employed prior to 2009, and using our present methods – but excluding the awkward transition from one to the other. In both cases, the period from the 2007 market peak through about November 2008 is the segment would have been most responsible for strong performance relative to the S&P 500 over the complete cycle. In contrast, the period from about April 2012 would have clearly lagged the market regardless of method. The crucial segment affected by stress-testing in this market cycle was between those points. We successfully avoided much of the market’s collapse in 2007-2009, but the unfortunate outcome of stress-testing was to miss the opportunity in 2009 to respond to the combination of improved valuations and market action. In hindsight, we know that both our pre-2009 and present methods (which did not yet exist at that time, but were also not “trained” on that data) could have seized the opportunity. Unfortunately, it was unclear at the time whether the state-of-the-world was better characterized by post-war data (in which our existing methods had performed well) or in Depression-era data in which our existing methods allowed greater periodic losses than I viewed as tolerable. Had our avoidance of the market’s deep losses in 2008 simply been followed by that normal ability to embrace market risk in 2009 (on the coupling of a retreat in valuations with improved market action), I doubt that anyone would think twice about whether our present defensiveness is credible. The good thing, of course, is that we’ll never be faced with a similar stress-testing need again, as we’ve validated our approach against available data going back to the time when Ulysses S. Grant was President. In any event, I doubt that we’ll have much to lament by the completion of the current market cycle. We know the risks inherent in present market conditions, and we know how those risks are typically resolved (as they were after 1929, 1972, 1987, 2000 and 2007). As a side note, when we compare the two, most of the differences between the pre-2009 methods (which were based solely on post-war U.S. data) and the more robust methods (that resulted from stress-testing against Depression-era data) relate to the considerations that define that “early improvement” in market action. Stocks were actually reasonably valued by October 2008 (see Why Warren Buffett is Right and Nobody Cares) and into early 2009. The problem with Depression-era data (as well as late-2008) is that measures of market action that worked just fine in the post-war period would have been ruthlessly whipsawed even if one relied heavily on trend-following features. Our present methods are more sensitive to measures of risk-premiums and default risk than the post-war methods were, require somewhat greater positive divergence as confirmation of “early improvement,” and include “ensemble” features that are also helpful across history. None of that, however, has encouraged us to embrace a set of persistently overvalued, overbought, overbullish, rising-yield market conditions more recently. I won’t tell you that this speculative run will end immediately. I can easily say, however, that our present defensiveness of our approach is well-informed historically, and that I haven’t the faintest inclination to believe that this time is different. Bubble Update Regardless of last week’s slight tapering of the Federal Reserve’s policy of quantitative easing, speculators appear intent on completing the same bubble pattern that has attended a score of previous financial bubbles in equity markets, commodities, and other assets throughout history and across the globe. The chart below provides some indication of our broader concerns here. The blue lines indicate the points of similarly overvalued, overbought, overbullish, rising-yield conditions across history (specific definitions and variants of this syndrome can be found in numerous prior weekly comments). Sentiment figures prior to the 1960’s are imputed based on the relationship between sentiment and the extent and volatility of prior market fluctuations, which largely drive that data. Most of the prior instances of this syndrome were not as extreme as at present (for example, valuations are now about 35% above the overvaluation threshold for other instances, overbought conditions are more extended here, and with 58% bulls and only 14% bears, current sentiment is also far more extreme than necessary). So we can certainly tighten up the criteria to exclude some of these instances, but it’s fair to say that present conditions are among the most extreme on record. This chart also provides some indication of our more recent frustration, as even this variant of “overvalued, overbought, overbullish, rising-yield” conditions emerged as early as February of this year and has appeared several times in the past year without event. My view remains that this does not likely reflect a permanent change in market dynamics – only a temporary deferral of what we can expect to be quite negative consequences for the market over the completion of this cycle.
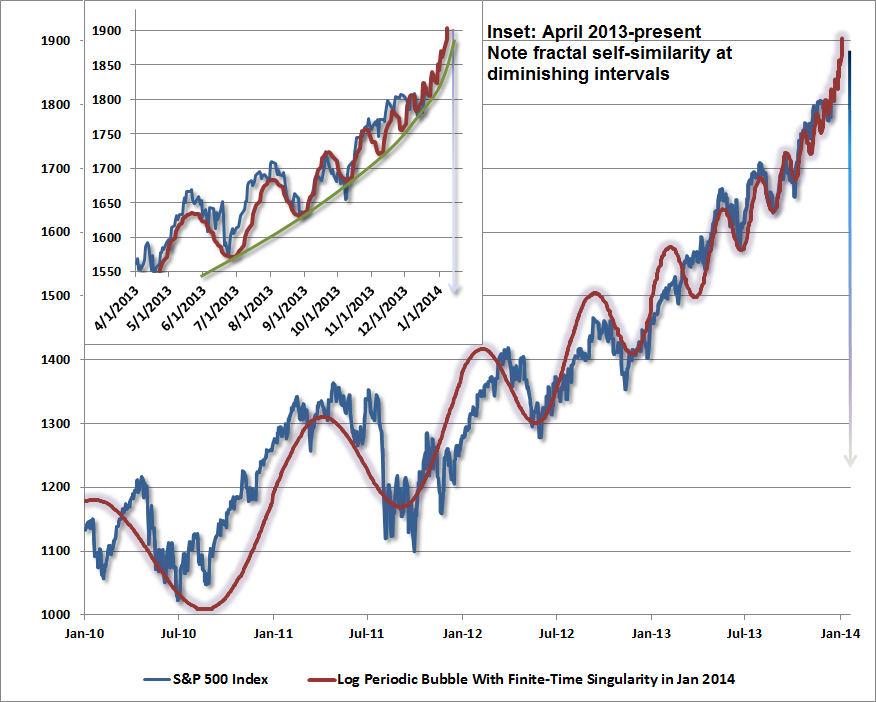
Narrowing our focus to the present advance, what concerns us isn’t simply the parabolic advance featuring increasingly immediate impulses to buy every dip – which is how we characterize the psychology behind log-periodic bubbles (described by Didier Sornette in Why Markets Crash). It’s that this parabola is attended by so many additional and historically regular hallmarks of late-phase speculative advances. Aside from strenuously overvalued, overbought, overbullish, rising-yield conditions, speculators are using record amounts of borrowed money to speculate in equities, with NYSE margin debt now close to 2.5% of GDP. This is a level seen only twice in history, briefly at the 2000 and 2007 market peaks. Margin debt is now at an amount equal to 26% of all commercial and industrial loans in the U.S. banking system. Meanwhile, we are again hearing chatter that the Federal Reserve has placed a “put option” or a “floor” under the stock market. As I observed at the 2007 peak, before the market plunged 55%, “Speculators hoping for a ‘Bernanke put’ to save their assets are likely to discover – too late – that the strike price is way out of the money.” The following chart is not a forecast, and certainly not something to be relied upon. It does, however, provide an indication of how Sornette-type bubbles have ended in numerous speculative episodes in history, in equities, commodities, and other assets, both in the U.S. and abroad. We are already well within the window of a “finite-time singularity” – the endpoint of such a bubble, but it is a feature of parabolas that small changes in the endpoint can significantly change the final value. The full litany of present conditions could almost be drawn from a textbook of pre-crash speculative advances. We observe the lowest bearish sentiment in over a quarter century, speculation in equities using record levels of margin debt, depressed mutual fund cash levels, heavy initial public offerings of stock, record issuance of low-grade “covenant lite” debt, strikingly rich valuations on a wide range of measures that closely correlate with subsequent market returns, faith that the Fed has put a “floor” under the market (oddly the same faith that investors relied on in 2007), and the proliferation of “this time is different” adjustments to historically reliable investment measures.
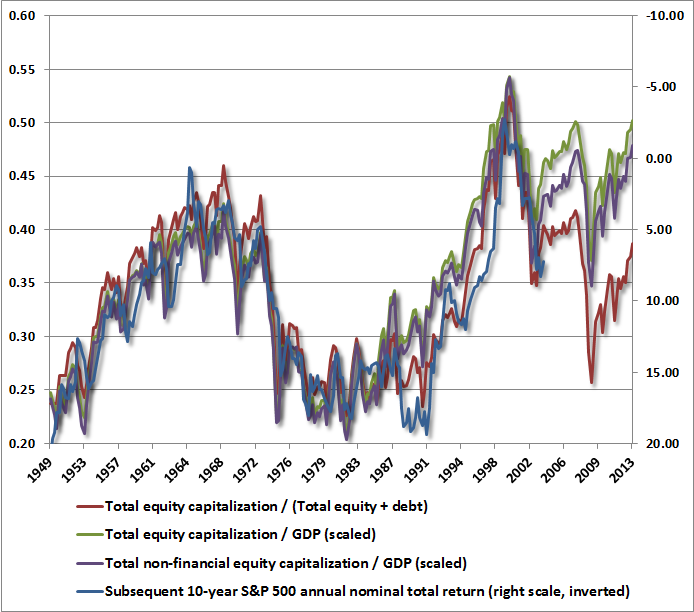
Even at 1818 on the S&P 500, we have to allow for the possibility that speculators have not entirely had their fill. In my view, the proper response is to maintain a historically-informed discipline, but with limited concessions (very small call option positions have a useful contingent profile) to at least reduce the temptation to capitulate out of undisciplined, price-driven frustration. Regardless of whether the market maintains its fidelity to a “log-periodic bubble,” we’ll continue to align our position with the expected return/risk profile as it shifts over time. That said, the “increasingly immediate impulses to buy every dip” that characterize market bubbles have now become so urgent that we have to allow for these waves to compress to a near-vertical finale. The present log-periodic bubble suggests that this speculative frenzy may very well have less than 5% to run between current levels and the third market collapse in just over a decade. As I advised in 2008 just before the market collapsed, be very alert to increasing volatility at 10-minute intervals. The bell has already rung. The diva is already singing. The only question is precisely how long they hold the note. Novel valuation measures The late stage of every speculative advance is littered with novel valuation measures intended to show that the old valuation metrics no longer apply. Most of these are very easy to confront with existing evidence. Sometimes, though, good arguments emerge that force us to dive deep into the data to figure out what might be useful. Whether we agree or disagree with a particular argument, we always have great respect for analysts who test their methods in decades of data, and show their work. A few pieces deserved special attention this week. One involved an argument relating to the Shiller P/E (the S&P 500 divided by the 10-year average of inflation-adjusted earnings). While I often quote the Shiller P/E as a “shorthand” for other measures of valuation, we use a broad range of valuation measures in practice, and all of the most reliable ones are quite extreme at the moment. Still, the Shiller multiple has been a particular target of late, with one recent article offering a particularly good challenge. I won’t spoil the ending here, as Bill Hester has done a nice job of forensic data analysis to show what’s going on in his research article this week Does the CAPE Still Work?. Suffice it to say that the Shiller P/E survives the challenge nicely. A second argument, which can be nicely shown in post-war data, is that the 10-year return on the S&P 500 is over 90% correlated with the ratio of total stock market capitalization to the sum of stock market and (essentially) bond market capitalization. That’s about the same correlation we get from good fundamentally-based models, but in this case, no fundamentals are being used. The argument is essentially that investors become accustomed to certain “preferred allocations” and that market valuations change over time in order to bring that about. Now, we know that the ratio of stock market capitalization to nominal GDP is already about 85% correlated with subsequent 10-year market returns even omitting dividend contributions, and we can easily factor those in to improve the relationship. Still, the correlation of the average equity allocation with subsequent 10-year market returns was intriguing. On further analysis, if one does the math, the mean reversion in the average investor equity allocation only explains about half of the total variation in market returns, which is unusually low for a good fundamental indicator. What’s going on is that the appearance of market capitalization in the denominator of the average investor allocation mutes the volatility of the indicator, but retains the overall correlation with subsequent returns. Examining the data, it turns out that the sum of equity and bond market capitalization is very smooth because bonds dominate. So variations in total equity market capitalization, compared with a relatively smoothly growing benchmark, are really what drive the correlation. Put simply, higher market capitalizations – relative to any reasonably smooth benchmark that grows somewhere close to the rate of nominal GDP – are associated with lower subsequent market returns. That should not be a surprising outcome, and there are a dozen ways to demonstrate this very robust historical fact. The regularity simply reflects the fact that equities are a claim on a very long-term stream of future cash flows, and equity prices are much more volatile than the rather smooth discounted value that those cash flows represent. One can criticize this regularity all one likes, as long as it is also clear that regularities like this allowed us - in real time - to confidently anticipate negative 10-year returns in 2000, identified steep overvaluation in 2007 (which was followed by a market decline that wiped out the entire total return of the S&P 500 - in excess of T-bill returns - all the way back to June 1995), and identified stocks as undervalued in 2009 (again, our stress-testing concerns at the time were not about valuation). The question then becomes – will any smoothly growing benchmark suffice? Here’s where a casual choice of benchmarks can invite a bit of trouble. The chart below plots several versions of “equity market capitalization” indicators, versus the actual subsequent 10-year total return of the S&P 500 Index. Note that all of these are nicely correlated with subsequent returns even up to the most recent 10-year period. But the version that normalizes equity market capitalization by the sum of equity and bond capitalization (the red line) seems more constructive than the others – still suggestive of 10-year nominal returns in the area of 6% annually.
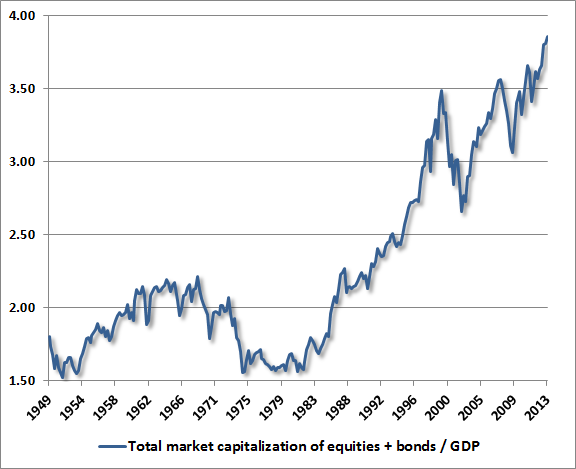
If we think carefully about the relationship between the denominators, it becomes clear why one of these things is not like the others. Specifically, notice that given the ratio of total equity capitalization to GDP, one can obtain the “average equity allocation” (total equity/(total equity + debt)) by dividing by the following factor: (total equity + debt) / GDP. Let’s look at this factor, because this is what drives the difference between the red line and the other market capitalization indicators.
Essentially, the average investor allocation to stocks is obtained by dividing the ratio of stock market capitalization/GDP by the factor plotted above. To the extent that depressed interest rates and elevated profit margins persist indefinitely, the explosion since the late-1990’s of corporate and government liabilities that must be supported by GDP may not be of concern. But we hesitate to normalize the elevated market capitalization of stocks by dividing by the number above, which largely reflects, well, the elevated market capitalization of both stocks and bonds. Again, despite any differences we may have with various analysts, we always admire the careful thinkers that show their work. A final argument going around is that somehow stock buybacks aren’t being factored into valuation multiples or estimates of future returns, the implication being that buybacks should be added in as an additional cash flow, or that investors should be paying a higher P/E multiple due to the higher per-share growth rate. With a bit of of tedious arithmetic, one can show using standard discounting models that in the presence of buybacks, the level and growth rate of per-share fundamentals adjust to fully account for the buybacks, making further adjustments double-counting. The same is true for P/E ratios, which should not be adjusted further. [Geek's Note – Consider the dividend discount model where a company earns E, invests enough to ensure future growth at rate g, leaving C as distributable free cash flow, paying a fraction f of C as dividends D, and using the remainder to repurchase stock at fair value. Given an expected return k, the aggregate value of the firm’s equity is C/(k-g) regardless of whether the free cash flow is deployed as dividends or stock buybacks. But in the presence of buybacks, the per share price P works out – tediously – to be DPS/f(k-g) where DPS is the dividend per share. As long as one uses per share fundamentals and growth rates - and make no mistake, Standard and Poors calculates S&P 500 fundamentals on a "per share" basis that adjusts the index divisor for buybacks - no further adjustments are necessary. Even the standard dividend discount model needs no adjustment once per-share measures are used, as P = DPS/(k-g*) where g* = k - f(k-g) is the per-share growth rate in the presence of buybacks (and is just g when f = 1). In the presence of buybacks, the per-share growth rate of earnings, dividends and other fundamentals may be faster at g*, but this doesn’t affect the P/E either. To see this, write the ratio of free cash flow to earnings as q, which is not dependent on buybacks. We can then write DPS = fqEPS. In the absence of buybacks, the share price is qEPS/(k-g) and the P/E ratio is q/(k-g). In the presence of buybacks the share price is fqEPS/f(k-g). The f drops out, and the P/E ratio remains the same. Importantly, if companies in aggregate make a habit of repurchasing their stock in elevated markets, and find it necessary to reissue stock in depressed markets in order to raise capital - an apt description of recent cycles in the U.S. and globally - the per-share growth rate will actually fall short of the firm-wide growth rate over the complete cycle, but that's more algebra than anyone needs to handle during the holidays.] NEW from Bill Hester: Does the CAPE Still Work? The foregoing comments represent the general investment analysis and economic views of the Advisor, and are provided solely for the purpose of information, instruction and discourse. Only comments in the Fund Notes section relate specifically to the Hussman Funds and the investment positions of the Funds. Fund Notes As of last week, Strategic Growth Fund remained fully hedged, with a “staggered strike” hedge that raises the strike prices of the Fund’s put options within a few percent of present market levels. The Fund also has a small position in out-of-the-money index call options, largely as a concession to a final speculative “blowoff” that we’ve allowed for in the past few months. While we’ve had our share of challenges in the half-cycle since 2009, particularly related to our decision to stress-test our methods against Depression-era data and the returns we missed in the interim, Strategic Growth remains ahead of the S&P 500 since its inception in 2000. In the interim, the deepest loss in the S&P 500 since 2000 – on a compound basis – was 37.4% deeper than the deepest loss experienced by Strategic Growth Fund. It is worth understanding the mathematics of compounding: to turn a 25% loss into a 55% loss, an investor must lose another 40% of portfolio value. Despite the challenges of the recent half-cycle, I certainly believe that the risks we accept are commensurate with the long-term returns we pursue. I believe that the complete peak-to-peak market cycle from 2000 to 2007 was neither extraordinary nor disappointing in that regard. Particularly over the short run, however, we can’t rule out at least a brief continuation of the recent speculative run. While small call option positions may help to reduce our discomfort with a defensive position in that event, I should be clear that our return/risk measures remain strongly negative here, so those call positions are not large enough to represent a significant positive exposure to market fluctuations. Investors seeking positive exposure can find it easily enough without our involvement or agreement. My hope is that long-term shareholders will be guided by a patient, informed, full-cycle discipline. Strategic International remains fully hedged. Strategic Dividend Value is hedged at about 50% of the value of its holdings. Strategic Total Return has a duration of just over 5 years (meaning that a 100 basis point fluctuation in interest rates would be expected to impact Fund value by about 5% on the basis of bond price fluctuations), with a small percentage of assets in precious metals shares and utility shares. Wishing you wonderful holidays, and always, thank you for your trust. Know that I hold it as both the gift and the responsibility that it is.--- The foregoing comments represent the general investment analysis and economic views of the Advisor, and are provided solely for the purpose of information, instruction and discourse. Prospectuses for the Hussman Strategic Growth Fund, the Hussman Strategic Total Return Fund, the Hussman Strategic International Fund, and the Hussman Strategic Dividend Value Fund, as well as Fund reports and other information, are available by clicking "The Funds" menu button from any page of this website. |
|||||||||||||||||||||||||
|
For more information about investing in the Hussman Funds, please call us at
1-800-HUSSMAN (1-800-487-7626) 513-326-3551 outside the United States Site and site contents © copyright Hussman Funds. Brief quotations including attribution and a direct link to this site (www.hussmanfunds.com) are authorized. All other rights reserved and actively enforced. Extensive or unattributed reproduction of text or research findings are violations of copyright law. Site design by 1WebsiteDesigners. |