|
|
||||||
|
|

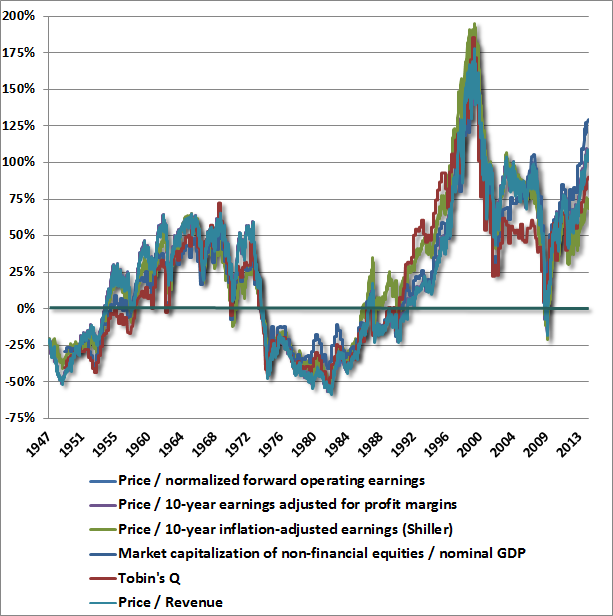
March 3, 2014 Do Foreign Profits Explain Elevated Profit Margins? No. Last week, the S&P 500 closed at a record high. Based on valuation measures that have maintained a nearly 90% correlation with subsequent 10-year total returns (not only historically, but also in more recent decades), we estimate that the S&P 500 is more than 100% above the level at which it would be priced to achieve historically normal returns in the coming years. Another way to say this is that at current prices, we estimate negative total returns for the S&P 500 on horizons of 7-years and less, and nominal total returns for the S&P 500 averaging just 2.4% annually over the coming decade, with historically normal total returns thereafter. Needless to say, a steep intervening retreat in stocks could result in much stronger return prospects much, much sooner than 7-10 years from now. The accompanying charts bring these estimates up to date. The first presents a broad range of reliable fundamentals versus their historical norms.
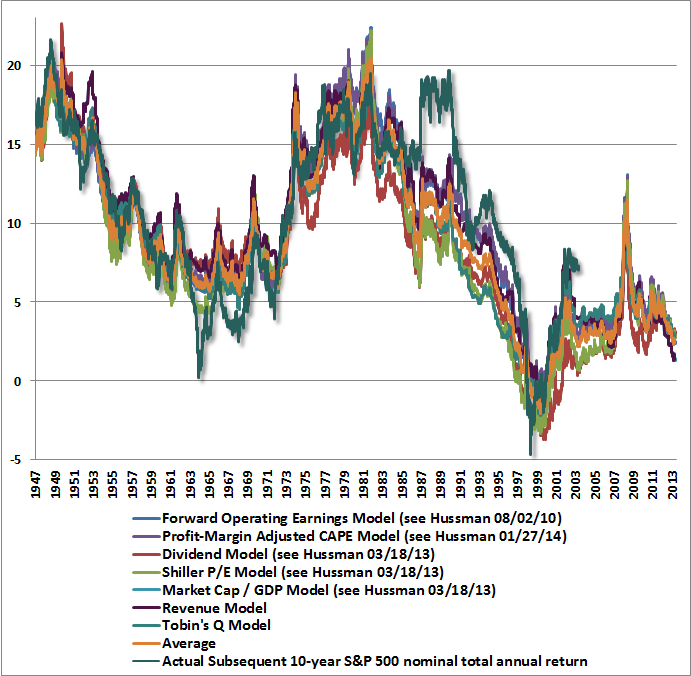
The next chart underscores the close relationship between these measures and actual subsequent market returns. The various models include properly estimated dividend income, and are detailed in a variety of prior weekly comments. The Tobin’s Q and revenue model are straightforward variants of the others. Given a prospective 2.4% total return for the S&P 500 over the coming decade (albeit with considerable risk of steep intervening losses), a 10-year bond yield near 2.6%, and the likelihood of depressed short-term interest rates in the foreseeable future, an evenly balanced portfolio of stocks, bonds and cash can be expected to achieve an average nominal total return of only about 2% annually over the coming decade from present valuations. We believe there will be numerous opportunities in the coming quarters and years to commit capital at significantly higher prospective returns and significantly diminished risk of capital loss. Investors, particularly equity investors, are gambling their financial future in a casino where the odds are increasingly against them.
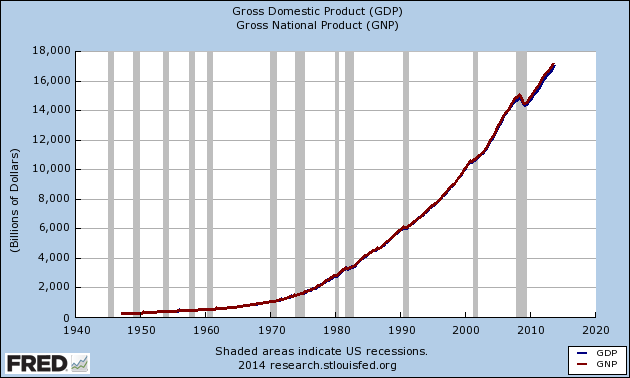
On a valuation basis, stocks are far more overvalued than they were in October 1987, and less overvalued than they were in 2000, but both points warranted a strongly defensive stance because of the syndrome of conditions that emerged. Conversely, stocks were meaningfully overvalued in early 2003 when we shifted to a positive investment outlook, because market action was supportive and historically dangerous features were absent.Valuations alone have little bearing on what investors can expect from stocks over the next several weeks, months, or even quarters. Returns on these horizons will remain dominated by a broad ensemble of considerations that include market action, sentiment, overbought/oversold conditions, and properly defined monetary factors, among others. It’s quite true that in recent quarters, the market has entirely ignored strenuously overvalued, overbought, overbullish conditions that have historically resulted in steep losses regardless of trend or monetary conditions. We continue to view this as a deferral, not avoidance, of negative consequences – most probably including market losses in excess of 40% over the completion of the present market cycle. In short, our views regarding valuation are hardly the sole drivers of our investment stance. The central impact of valuations is primarily on horizons of 7-10 years, and we expect strong opportunities to embrace a constructive stance even a few quarters from now. Provided a moderate retreat in valuations followed by an early improvement in market internals, this sort of constructive shift would be likely even if stocks remained richly priced from a longer-term perspective. What matters is the ensemble of evidence, and as that changes, so will our outlook. Meanwhile, we remain very optimistic about the prospects for remarkably better investment opportunities over the completion of the present market cycle and beyond. Our concerns about present conditions should not dim our enthusiasm about the longer-term outlook, provided that we maintain patience, and insist on accepting significant investment exposure only at points when risk is associated with strong expected returns. Profits and national income Over the years – particularly in 2000, 2007 and again today, we’ve found that one of the hazards of having strongly-held and evidence-driven convictions about valuations, profit margins, and historically extreme conditions is that our work becomes a lightning rod for those who prefer reckless speculation to continue without any reminder that deep losses are increasingly likely. We certainly appreciate informed debate. It's the "Here's a simple reason why all of history suddenly doesn't matter" sort of loose-cannon analysis that gets our eyes rolling. The latest variant focuses on our view of profit margins. The December 16, 2013 weekly comment, The Coming Retreat in Corporate Earnings details this aspect of our work and the associated data. As I noted then, “My concern at present is emphatically not simply a concern about the near-term direction of earnings, or any assumption that stocks must closely follow earnings. Rather, my present concern is much more secular in nature. It can be expressed very simply: investors are taking current earnings at face value, as if they are representative of long-term flows, at a time when current earnings are more unrepresentative of those flows than at any time in history. The problem is not simply that earnings are likely to retreat deeply over the next few years. Rather, the problem is that investors have embedded the assumption of permanently elevated profit margins into stock prices.” I’ve noted frequently that after-tax corporate profits as a share of national income are about 70% above historical norms; that these profit shares are heavily mean-reverting and strongly (inversely) associated with subsequent profit growth over the following 3-4 year period; and that the current surplus of corporate profits is the mirror-image of corresponding deficits in household and government savings (a relationship detailed in prior weekly comments). Recent profits data, as well as the entire historical record, are tightly explained by these factors. Notably, this data is derived from the national income accounts computed by the Bureau of Economic Analysis, and it’s worth understanding how the BEA computes profits. Specifically, the BEA points out, “Because national income is defined as the income of U.S. residents, its profits component includes income earned abroad by U.S. corporations and excludes income earned in the United States by foreigners.” To normalize corporate profits relative to the overall economy, I’ve typically divided them by U.S. GDP. This is somehow taken as a striking error by some, who argue that the relevant profit share should be obtained by dividing the BEA corporate profit figures by a measure that similarly includes production abroad by U.S. corporations and excludes production in the United States by foreigners. This technically appropriate figure is Gross National Product (by contrast, Gross Domestic Product captures output generated domestically in the United States, regardless of whether it was generated by a foreign or domestic company or individual). Want to know how large the difference is between the level of Gross National Product and Gross Domestic Product? About one-half of one percent. The distinction is virtually meaningless.
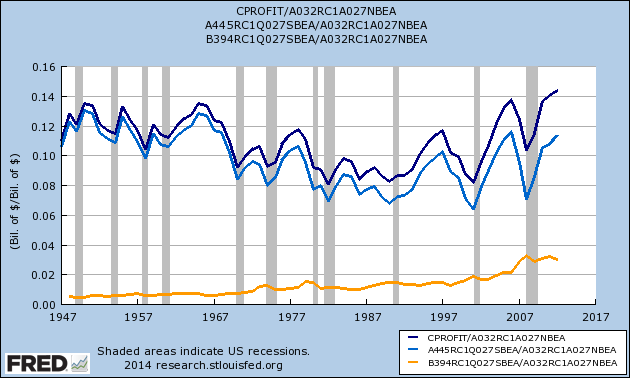
Others have suggested that corporate profits should be compared not to U.S. GDP, but global GDP instead. But a profit share is properly viewed as profits / income. If global GDP was the appropriate denominator, then global profits across all companies worldwide would be the relevant numerator, and we would no longer be talking about the U.S. at all. We saw an unfortunate bit of analysis circulating last week, imagining that concerns about extremely elevated corporate profits (relative to revenues, GDP, GNP, and national income – all of which happen to produce nearly identical conclusions) simply reflect a failure to use the correct divisor. Intending to support the "incorrect denominator" argument, the following chart was presented, (which took a bit of data forensics to replicate, for reasons that will be apparent shortly). The chart still suggests that profit shares are high relative to history, but not to the extreme that other research (including our own) suggests. The lines were labeled “National profits / national income”, with the top line as “Total”, the second line “From U.S.” and the third line “From abroad.”
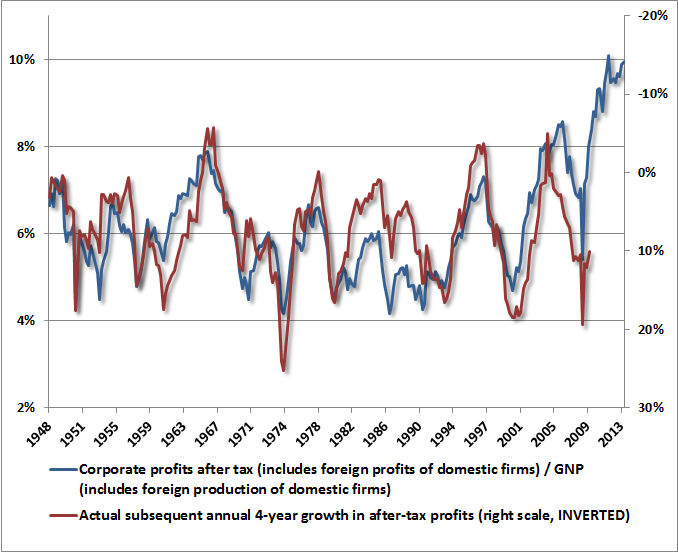
The problem is that the analyst’s conclusion that profit shares are just fine has absolutely nothing to do with the distinction between national income and domestic income (using either denominator would produce the same graph). Despite claims that this distinction drives the results, the entire analysis is actually driven by the fact that pre-tax profits have been inadvertently used in the numerators. Meanwhile, the analyst has inexplicably opted to use net national income in the denominator, which subtracts out depreciation (consumption of fixed capital or CFC) of fixed private investment and government gross investment. This causes the resulting income figure to diverge from both GDP and GNP in a way that does little but introduce additional noise. What should we make of this unintentional exploration of pre-tax profit shares? An examination of historical movements in corporate profits produces very straightforward conclusions. First, after-tax profits are the basis of competition and arbitrage among corporations over time, and have a strong mean-reverting tendency. As a result, elevated profits as a share of income are predictably followed by sub-par profit growth over the following 4-years or so. Second, taxes act as a “layer” on top of this mean-reverting process, meaning that pre-tax profits also tend to mean-revert, but the level that they revert to shifts over time with the tax burden. Tax burdens certainly affect profit margins over a small number of years, but a reduction or increase in the tax burden does not have a permanent effect on the long-term level of after-tax profit margins in a competitive economy. In any event, both pre-tax and after-tax margins are inversely correlated with subsequent 4-year earnings growth (pre-tax or after-tax), and for all permutations of these, the implications for earnings are negative for the coming years. The bottom line is simple. Corporate after-tax profits as a share of GDP, GNP (or even net national product if one wishes to use that number) are steeply above historical norms, and the pre-tax profit share is also at record levels. This fact can be fully explained by mirror image deficits in household and government saving - a relationship that can be demonstrated across decades of historical evidence. As a result of a severe credit crisis and a sustained period of lackluster economic activity, we’ve seen a fiscal deficit (elevated transfer payments to households and shortfalls in tax revenue) combined with weak household saving. The combined effect is that companies have been able to maintain revenues while paying a very low share of income to labor and taxes. Given the economic landscape of recent years, large offsetting sectoral deficits and surpluses are not surprising, but they should not be taken as evidence that the long-term profitability of the corporate sector has permanently shifted higher. Stocks are not a claim to a few years of cash flows, but decades and decades of them. By pricing stocks as if current profits are representative of the indefinite future, investors have ensured themselves a rude awakening over time. Equity valuations are decidedly a long-term proposition, and from present levels, the implied long-term returns are quite dim. The chart below (CPATAX/GNP) provides a good summary of the present situation, and a reasonable sense of what we expect for corporate profit growth over the coming several years.
Postscript: In order to incorporate estimated foreign revenues into a historically consistent valuation measure, I introduced a novel metric based on market capitalization to national nonfinancial gross value added. See the May 5, 2015 comment The "New Era" is an Old Story (and introducing Market Cap/GVA) for details. The foregoing comments represent the general investment analysis and economic views of the Advisor, and are provided solely for the purpose of information, instruction and discourse. Only comments in the Fund Notes section relate specifically to the Hussman Funds and the investment positions of the Funds. Fund Notes We continue to view stocks as strenuously overvalued, but that alone does not drive our investment stance. What concerns us beyond valuations is the full ensemble of overvalued, overbought, overbullish conditions, coupled with textbook speculative features (soaring margin debt, heavy issuance of low-grade “covenant lite” debt, heavy initial public offerings of speculative companies), and growing internal divergences in price action and leadership. Our avoidance of market risk, and tightly hedged investment stance, does not reflect expectations of immediate market losses in this specific instance, but instead reflects the experience of severe average losses when similar conditions have been observed in a century of historical data. This time may be different. That is certainly the perennial argument, and at least in recent years, enthusiasm about quantitative easing has made it so. Still, we don’t observe any mechanism by which quantitative easing affects the economy or stock prices except by depriving investors of safe yield and making them feel forced to reach for yield in more speculative assets. This is essentially the same process that created the housing crisis, and we view the speculation in equities as equally severe today. Our concerns about market risk at present should be taken in the context of our great optimism about the prospects for strong investment opportunities over the completion of the present market cycle. The Hussman Funds remain defensively positioned in equities, with a moderately constructive stance toward Treasury securities and precious metals shares. --- The foregoing comments represent the general investment analysis and economic views of the Advisor, and are provided solely for the purpose of information, instruction and discourse. Prospectuses for the Hussman Strategic Growth Fund, the Hussman Strategic Total Return Fund, the Hussman Strategic International Fund, and the Hussman Strategic Dividend Value Fund, as well as Fund reports and other information, are available by clicking "The Funds" menu button from any page of this website. |
|||||||||||||||||||||||||
|
For more information about investing in the Hussman Funds, please call us at
1-800-HUSSMAN (1-800-487-7626) 513-326-3551 outside the United States Site and site contents © copyright Hussman Funds. Brief quotations including attribution and a direct link to this site (www.hussmanfunds.com) are authorized. All other rights reserved and actively enforced. Extensive or unattributed reproduction of text or research findings are violations of copyright law. Site design by 1WebsiteDesigners. |