|
|
||||||
|
|

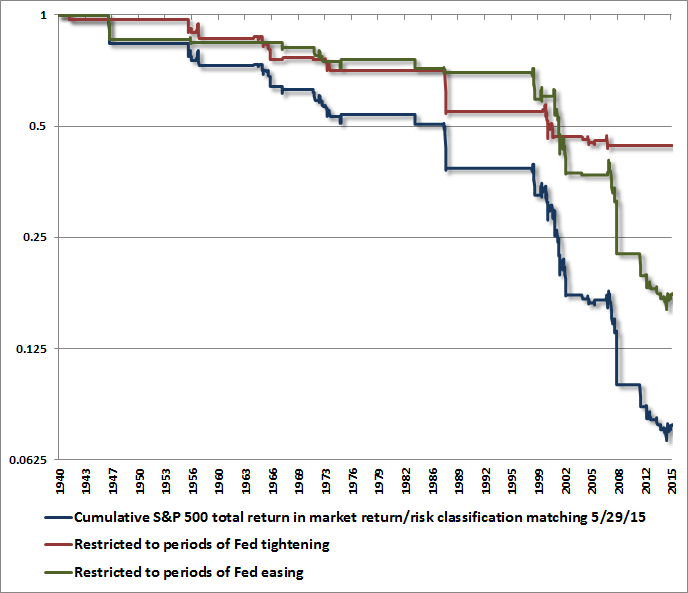
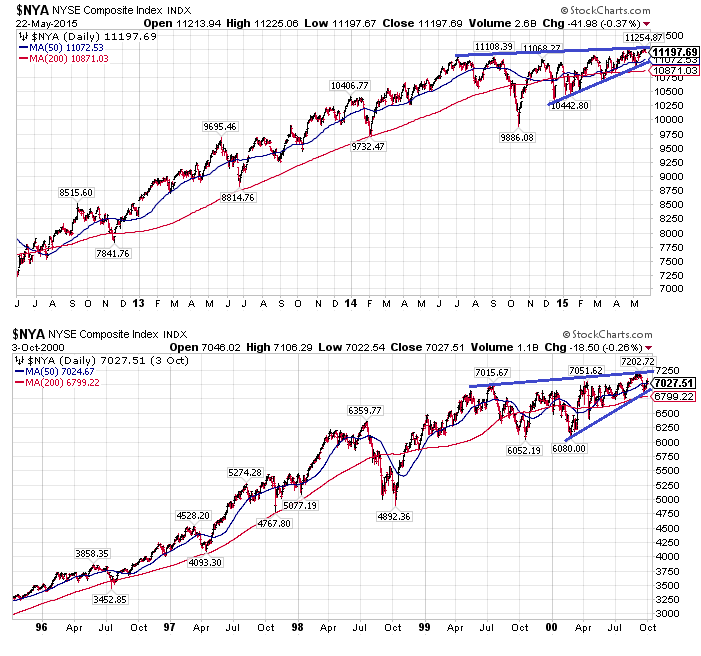
June 1, 2015 When Paper Wealth Vanishes Present market conditions join the second most extreme valuations in U.S. history (on measures most reliably correlated with actual subsequent 10-year S&P 500 total returns) with increasing divergences and dispersion in market internals. Despite current extremes, valuations say very little about near term market direction. Valuations are enormously informative about likely market returns over horizons of 7-15 years. In contrast, market internals convey a great deal of information about the prevailing risk preferences of investors, and that's what amplifies our concerns here. Uniformly favorable internals across a wide variety of sectors and security types typically convey a signal that investors have a robust willingness to seek and accept risk, and it’s that feature that can allow overvalued markets to become persistently more overvalued. But remove that feature, and overvalued markets have often become vulnerable to vertical air pockets, panics, and crashes. I’ll say this again – valuations alone are not the concern. It’s the additional feature of deteriorating market internals that introduces a critical element of risk here. That feature helped us to correctly warn of the 2000-2002 and 2007-2009 collapses, and shift to a constructive outlook in-between. The recent half-cycle since 2009 has been more challenging as the inadvertent result of my 2009 insistence on stress-testing our methods of classifying market return/risk profiles against Depression-era data. The resulting ensemble methods outperformed every approach we had ever tested against post-war data, Depression-era data, and holdout validation data, but they also encouraged an immediate defensive stance when overvalued, overbought, overbullish syndromes emerged. Throughout history, those syndromes had regularly been accompanied or closely followed by breakdowns in market internals. The one truly “different” aspect of the half-cycle since 2009 is that quantitative easing disrupted that regularity. Nearly a year ago, we imposed overlays on our methods that require hard-defensive investment stances to be accompanied directly by deterioration in market internals or other risk-sensitive measures (e.g. credit spreads). It’s worth emphasizing that until mid-2014, the strongly defensive outlook we took in recent years would have been rejected by those overlays more than two-thirds of the time. Without those bubble-tolerant overlays, our actual experience was largely a mirror image (though muted) of the escalating valuation extremes. As I observed then, we don't get to re-live the recent cycle in a way that demonstrates the effectiveness of those adaptations, but we can certainly do so over time. On that front, market conditions presently (and in recent quarters) support a hard-defensive outlook that's largely identical to those we took in 2000 and 2007. The same return/risk profile has been associated with vertical market losses in market cycles across history. The chart below shows the cumulative total return of the S&P 500, restricted to the 8% of historical periods with an estimated return/risk profile matching what we presently observe. The overall returns are also partitioned between periods of Fed easing and Fed tightening. The notion that Federal Reserve easing prevents market losses is simply historically uninformed. Even a cursory review of the last two market collapses should suffice as a reminder. What creates a temptation to ignore risk here is that the S&P 500 has recently advanced despite these conditions. Recognize that this has also periodically occurred in prior instances, but the average outcome is still substantially negative. In contrast, the broad market (see for example the NYSE Composite) has been in a sideways distribution pattern for nearly a year. The chart below compares recent action in the NYSE Composite to the period surrounding the 2000 peak. Narrowing broad market participation coupled with recent highs in the S&P 500 and Nasdaq does create a short-term challenge for hedged equity strategies – which are typically diversified across broad range of equities and hedged with large-cap indices – but we certainly don’t view that as a reason to reduce defenses here. That said, an improvement in market internals and credit spreads would reduce the urgency of our downside concerns.
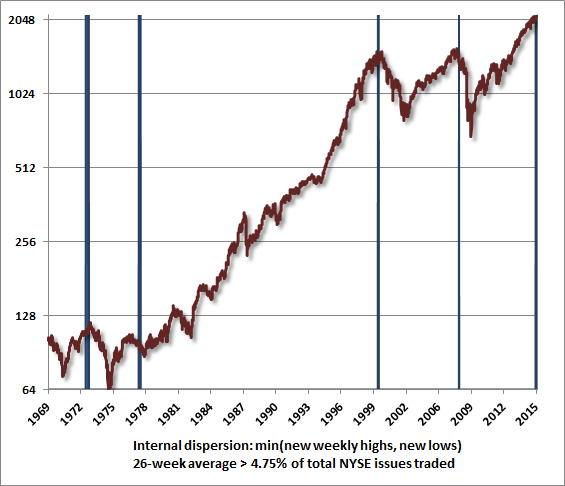
Meanwhile, we observe a great deal of internal dispersion on the leadership front (new highs and new lows). Though it’s not a particularly ominous indication by itself, we do see a much larger than normal share of issues trading at new 52-week lows than is typically consistent with a healthy advance or strong investor preferences toward risk. A simple way to get at this was suggested decades ago by Norm Fosback – examine the smaller of new highs and new lows, as a share of total issues traded. At present, the 26-week average of that figure is greater than 4.75% of issues traded – a level that we’ve only seen a handful of times since the 1970’s.
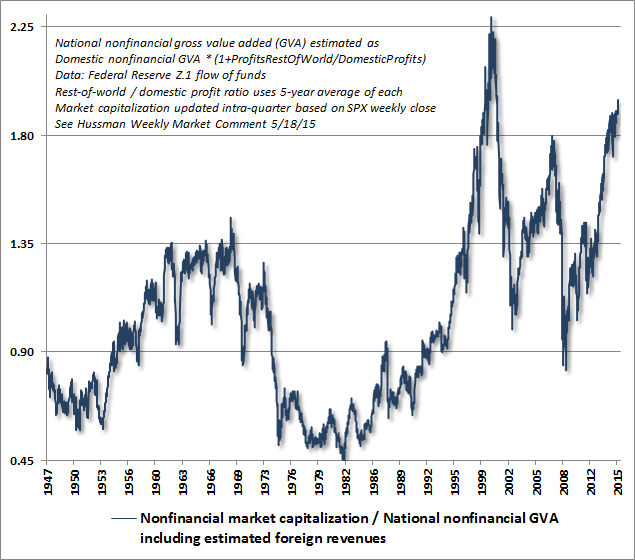
Presently, the valuation of the S&P 500 is within about 16% of the 2000 peak, on the most historically reliable measures we identify. Moreover, valuation extremes were only greater in 2000 on capitalization-weighted indices. Today, the median stock is more richly valued than at any point in U.S. history, including 2000. The following chart is perhaps one last look – unless market internals reverse course – at the extreme to which Fed-induced yield-seeking speculation has taken equity valuations. Market capitalization to national gross value added – a measure that I introduced a few weeks ago (see The “New Era” is an Old Story) – is better correlated with actual subsequent market returns than any widely followed valuation measure we’ve examined, including price/forward operating earnings, the Fed Model, the Shiller P/E, Tobin’s Q, market capitalization to GDP, and others. The following chart shows a weekly conversion of quarterly data, using the S&P 500 to proxy intra-quarter market fluctuations (adjusting for intra-quarter changes in GVA would have negligible impact).
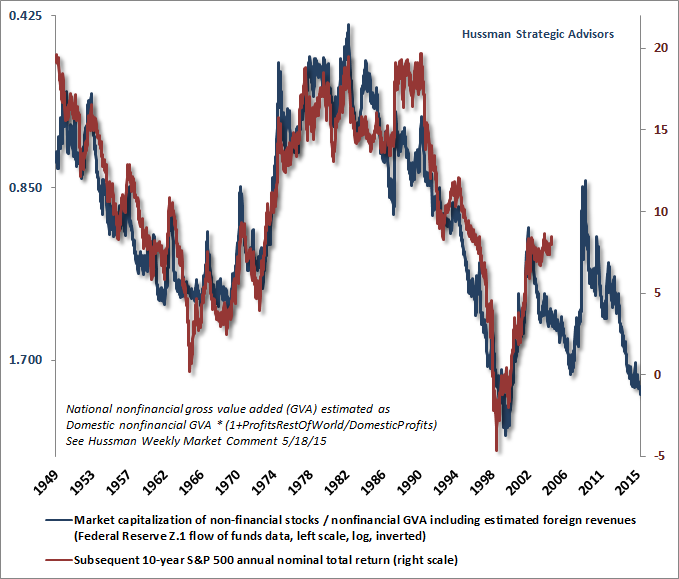
The next chart shows the relationship of this measure to actual subsequent nominal annual total returns in the S&P 500 Index over the following decade (shown this time on an inverted log scale, alongside actual subsequent market returns). From current valuations, this measure implies that equities are likely to lose value, including dividends, over the coming decade. As we saw in the decade following the 2000 peak, we expect the equity market to experience much more severe interim losses along the way.
The Federal Reserve hasn’t created a perpetual money machine. No, no, no, no, no. What the Fed has done is to encourage investors to chase yields and to speculate, to the point where stocks are now so overvalued that they can be expected to enjoy no further return at all over the coming decade. That’s how security pricing works. The higher the price an investor pays for a given stream of future expected cash flows, the lower the subsequent return an investor can expect to enjoy. The gains have already been had, at least on paper, though the holders who successfully realize these paper gains will do so through a needle’s eye. The past few quarters appear to be part of that distribution process. Volume picks up as holders attempt to sell and those shares are absorbed by dip-buyers, followed by low-volume short squeezes as sellers back off, and then return after those rallies with additional rounds of distribution. As long as only a few investors attempt to do so, any individual can cash out, but only by successfully selling their shares to some other investor at current levels. In aggregate, investors can’t exit, because somebody has to hold the stuff. For most investors, the majority of the paper gains that have emerged during the advancing half-cycle since 2009 will simply vanish over the completion of the cycle. As in equal or lesser speculative bubbles across history, there’s a common delusion that elevated stock prices represent wealth to their holders. That is a fallacy, and we can hardly believe that given the collapses that followed the 2000 and 2007 extremes, investors (and even Fed policymakers) would again fall for that fallacy so readily. The actual wealth is in the cash flows that are ultimately delivered into the hands of shareholders over time. Individuals can realize their paper wealth by selling now to some other investor and receiving cash in return, but only a small proportion of investors can actually convert current paper wealth into cash by selling to other investors without disrupting the bubble. The new buyer then receives whatever cash flows the stock delivers into the hands of existing holders, and can eventually sell the claim to the remaining stream of future cash flows to yet another investor. Ultimately, a share of stock is nothing but a claim on the long-term stream of cash flows that will be delivered into the hands of its holders over time. The current price and the future cash flows are linked together by a rate of return: the higher the price you pay today for a given stream of future cash flows, the lower the rate of return you can expect achieve by holding that investment over the long-term. There’s not a single market cycle in the historical record where the ratio of market capitalization to corporate gross value added (GVA) did not fall to about half the level that we observe today (or lower). Our view is that the level of the S&P 500 today is currently higher than the level investors will observe a decade from today, but dividends should make up the difference to provide an expected total return of roughly zero. In a zero return world, some may see this hypervaluation as “fair” – and those investors are free to call stocks “fairly valued relative to interest rates.” But the prospective 10-year return on the S&P 500, from current price levels, is still likely to be zero based on the most reliable valuation measures we identify. The appropriate response depends quite a bit on your investment horizon, your risk tolerance, the extent to which you wish to track the market (both up and down), and the extent to which you believe that market cycles can be navigated in a historically-informed way. If your current holdings are well aligned with your investment horizon and risk tolerance, and you don’t hold any views about market direction, or you don’t put much weight on cyclical market fluctuations, or you experience distress if even the most overvalued market advances without your participation, or you believe that “this time” is legitimately more “different” than it was in 2000 and 2007, or you don’t think that historical evidence is informative, then stick with a passive discipline and do nothing. All of those are legitimate considerations. I can explain how I process information and evidence, but others may process it differently. For my part, having completed the awkward transition from our pre-2009 methods to our present methods of classifying market return/risk profiles, I frankly expect our valuation concerns to be wildly vindicated over the completion of this market cycle, as they were the last two times around. I also expect to shift to a constructive or aggressive outlook after that decline, as I’ve done in previous market cycles (including – though truncated by my stress-testing decision – after the late-2008 collapse). I doubt that this bubble is different, but disagreement is what makes markets. In any event, at least think carefully about your risk tolerance now, and at least allow for the possibility that the market may trade at less than half its current level over the completion of the present market cycle (as it did following similar valuation extremes in 2000 and 2007). Think carefully about your investment horizon now. Invest on the understanding that the S&P 500 presently has an effective duration of about 50 years, and compare your existing assets to your expected future contributions. The shorter the horizon over which you’ll need the funds, and the less you expect to contribute relative to what you’ve accumulated already, the less exposure to equities you should consider. That’s not market timing – it’s sound financial planning. Given obscene valuations and a clear shift toward internal divergences and dispersion, following an extended syndrome of overvalued, overbought, overbullish extremes, whatever you’re going to do, I would strongly suggest that you do it now.The foregoing comments represent the general investment analysis and economic views of the Advisor, and are provided solely for the purpose of information, instruction and discourse. Please see periodic remarks on the Fund Notes and Commentary page for discussion relating specifically to the Hussman Funds and the investment positions of the Funds. --- The foregoing comments represent the general investment analysis and economic views of the Advisor, and are provided solely for the purpose of information, instruction and discourse. Prospectuses for the Hussman Strategic Growth Fund, the Hussman Strategic Total Return Fund, the Hussman Strategic International Fund, and the Hussman Strategic Dividend Value Fund, as well as Fund reports and other information, are available by clicking "The Funds" menu button from any page of this website. |
|||||||||||||||||||||||||
|
For more information about investing in the Hussman Funds, please call us at
1-800-HUSSMAN (1-800-487-7626) 513-326-3551 outside the United States Site and site contents © copyright Hussman Funds. Brief quotations including attribution and a direct link to this site (www.hussmanfunds.com) are authorized. All other rights reserved and actively enforced. Extensive or unattributed reproduction of text or research findings are violations of copyright law. Site design by 1WebsiteDesigners. |