|
|
||||||
|
|

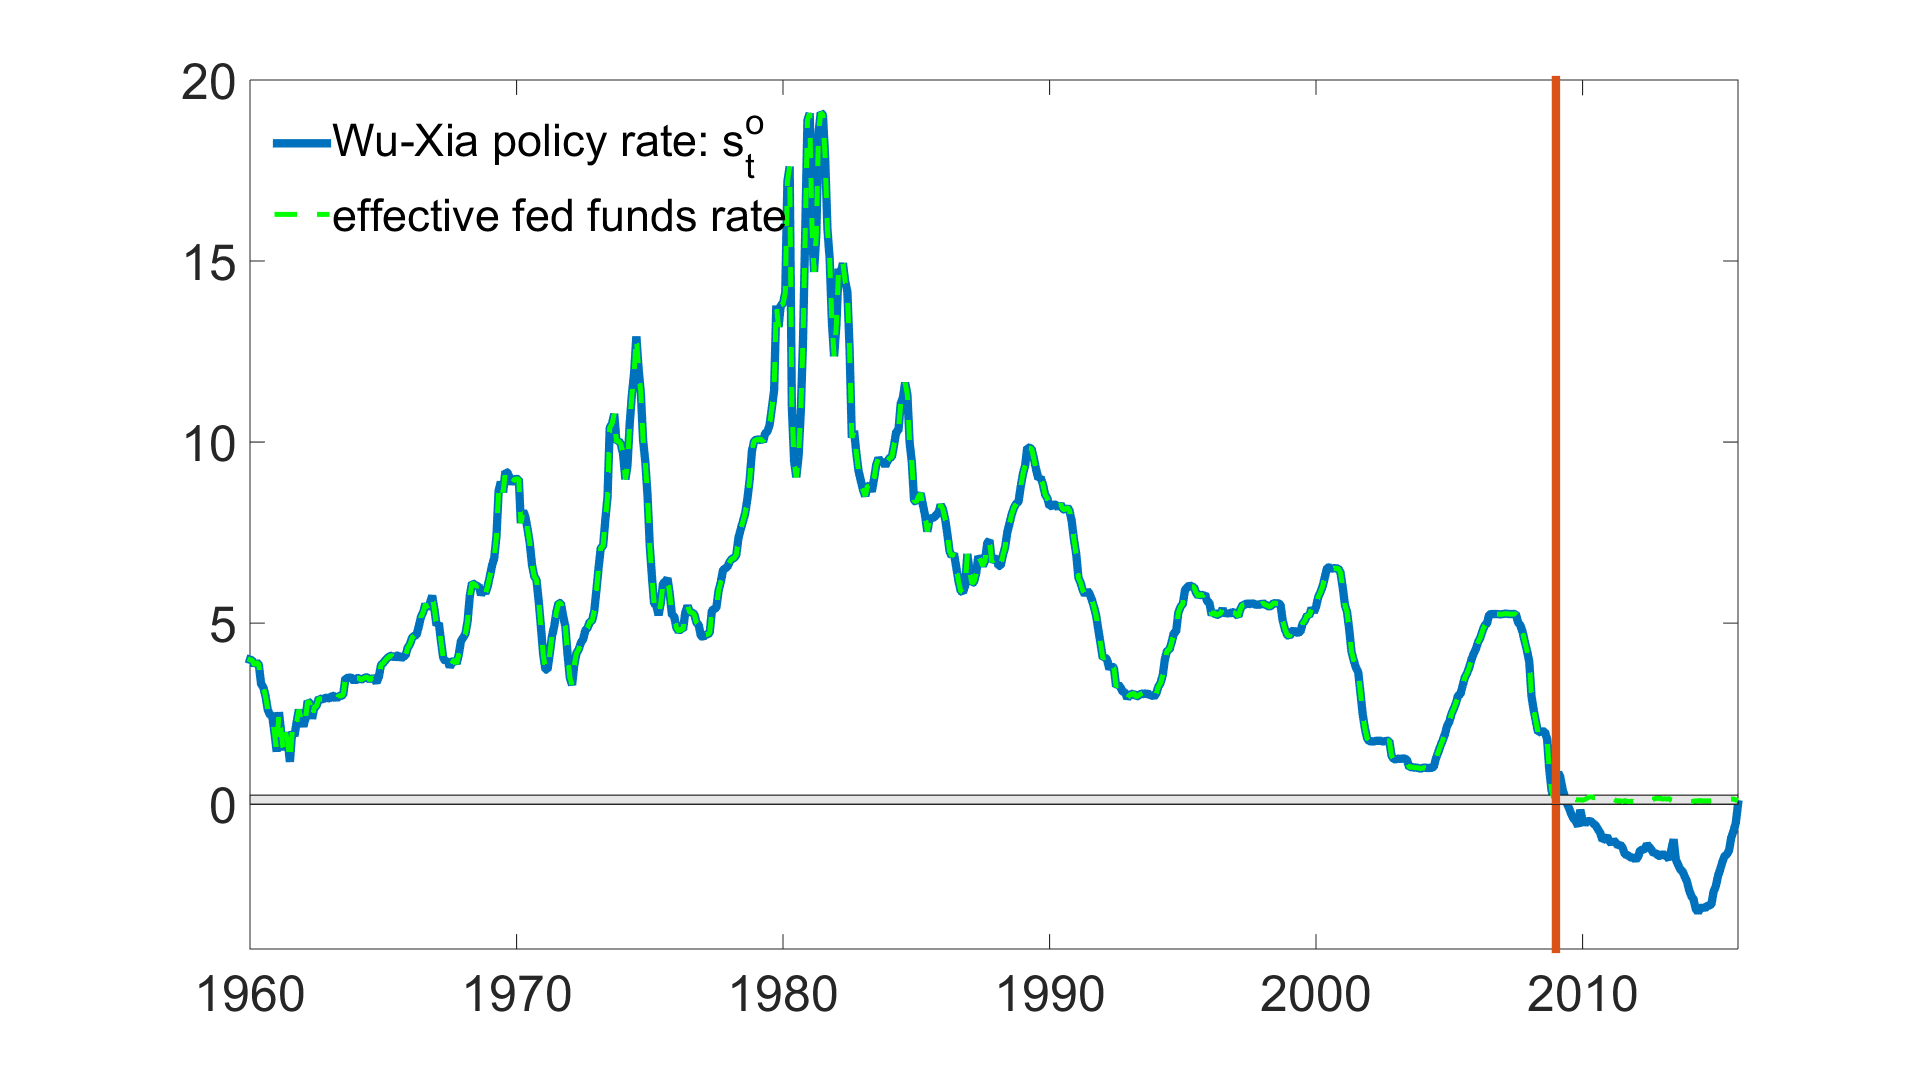
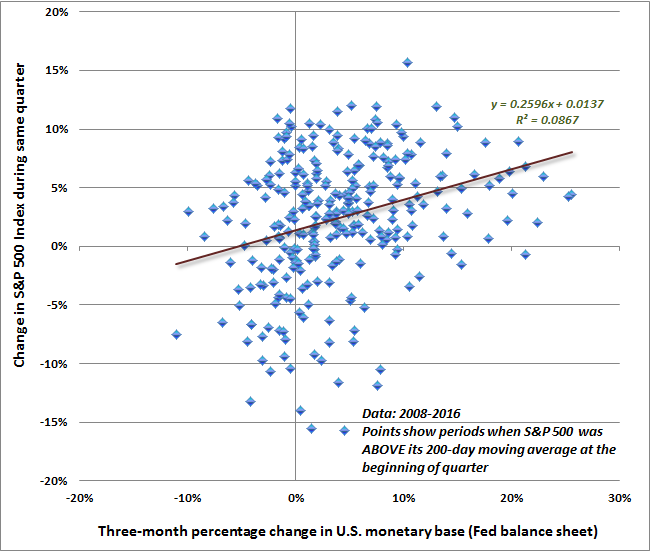
February 8, 2016 When Stocks Crash and Easy Money Doesn't Help Despite short-term interest rates being only a whisper above zero, we increasingly hear assertions that “financial conditions have tightened.” Now, understand that the reason they’ve “tightened” is that low-grade borrowers were able to issue a mountain of sketchy debt to yield-seeking speculators in recent years, encouraged by the Federal Reserve’s deranged program of quantitative easing, and that debt is beginning to be recognized as such. As default risk emerges and investors become more risk-averse, low-grade credit has weakened markedly. The correct conclusion to draw is that the consequences of misguided policies are predictably coming home to roost. But in the labyrinth of theoretically appealing but factually baseless notions that fill the minds of contemporary central bankers, the immediate temptation is to consider a return to the same misguided policies that got us here in the first place, just more aggressively. Credit default swaps continued to soar last week, particularly among European banks. Given that risks surrounding China and the energy sector are widely discussed, European banks continue to have my vote for “most likely crisis from left field.” With regard to the stock market, I suspect that the first event in the completion of the current market cycle may be a vertical loss that would put the S&P 500 in the mid-1500’s in short order. That area is a widely-recognized “role-reversal” support level matching the 2000 and 2007 market peaks, and would at least bring our estimates of prospective 10-year S&P 500 nominal total returns to about 5%, which seems a reasonable place for value-conscious investors to halt the initial leg down. I’ve often noted the historical signature of market crashes: a sustained period of overvalued, overbought, overbullish conditions that is then coupled with a clear deterioration in market internals and hostile yield trends, particularly in the form of widening credit spreads. See my comments from the 2000 and 2007 market peaks about the identical syndrome at those points. Historically, what we know as “crashes” have followed only after a compressed, initial market loss on the order of about 14%, a recovery that retraces 1/3 to 2/3 of the initial decline; and finally a break below that initial low. That threshold is currently best delineated by the 1800-1820 level on the S&P 500. Emphatically, I would reel back the urgency of all of these concerns if market internals were to improve materially. When investors are risk-seeking, they tend to be indiscriminate about it. So favorable market internals, as discussed below, are indicative of risk-seeking preferences among investors. Understand now that given any set of conditions (e.g. valuations, leading economic data, Fed action), the markets and the economy respond differently to those conditions depending on whether people are inclined toward risk-seeking or instead risk-aversion. In a risk-seeking environment, investors incorrectly “learn” that historically reliable valuation measures are worthless, that every dip is a buying opportunity, that economic deterioration can be ignored, and that Fed easing always makes stocks go up. In an environment of risk-aversion, all of that incorrect “learning” is punished with a vengeance. In the fixed income market, we wouldn’t touch low-grade credit at present. Once credit spreads widen sharply, the default cycle tends to kick in several quarters later. The present situation is much like what we observed in early 2008, when we argued that it was impossible for financial companies to simply “come clean” about bad debts, because then as now, the bulk of the defaults were still to come (see How Canst Thou Know Thy Counterparty When Thou Knowest Not Thine Self?). As economic conditions have weakened, Treasury debt has been a safe-haven. Last week, the 10-year Treasury yield dropped to about 1.8%. My view is that a U.S. recession remains likely (see From Risk to Guarded Expectation of Recession and An Imminent Likelihood of Recession). Coupled with widening credit spreads, that supports the expectation for even lower yields. But as yields become compressed, Treasuries bonds often become vulnerable to short-term yield spikes that can easily wipe out a year or two of prospective income in a few days. For that reason, our view on bonds remains constructive but not aggressive, and our inclination would be to reduce duration exposure as yields fall and extend it in the event of those spikes. That brings us to precious metals. As I noted in the 1990’s, the strongest performance from gold stocks is generally associated with periods when 1) the year-over-year CPI inflation rate is higher than 6 months earlier; 2) Treasury yields are lower than 6 months earlier; 3) the ratio of spot gold to the XAU is greater than 4.0, and; 4) the ISM Purchasing Managers Index is below 50. All of those conditions have been present for the past couple of months, and gold stocks have staged a slightly delayed spike higher. That said, I should also note that in recent years, precious metals shares have periodically been hit hard despite the presence of three or all four of these conditions. The reason, I think, has been the recurring specter of global deflation. A useful way to pick up that risk is to be somewhat more cautious on this sector if the U.S. dollar index and credit spreads are both rising while inflation is still below about 2%. Unlike 2008 when the dollar started at a somewhat undervalued level on the basis of our joint-parity estimates, the U.S. dollar has already been steeply bid up as a result of continuing QE in Europe and Japan. With the dollar treading water at these heights, and the rate of inflation hovering close to 2%, we don’t observe a clear deflationary signal that might otherwise be a warning on gold. Overall, conditions support a positive outlook for precious metals shares, but we’d hesitate to be too aggressive in the absence of higher inflation or a retreat in the value of the U.S. dollar. Wu-Xia and the shadow rate In addition to observing widening credit spreads and other signs of increasing financial stress, we’re hearing assertions that the Federal Reserve made a “policy error” by raising rates in December. A historically-informed perspective is useful here, lest one mistakenly draws the impression that untethered monetary easing is the cure rather than the disease. The fact is that the benefits of years of quantitative easing, as well as the potential costs of the December rate hike, both pale in comparison to the damage that the Fed has effectively baked in the cake through years of financial distortion. As I noted last month in Deja Vu: The Fed’s Real Policy Error Was To Encourage Years of Speculation: “Based on a broad range of economic factors, our economic outlook has shifted to a guarded expectation of recession. Now, if there was historical evidence to demonstrate that activist Fed policy had a significant and reliable impact on the real economy, and didn’t result in ultimately violent side-effects, we would argue that a Fed hike here and now might be a ‘policy error.’ In reality, however, decades of economic evidence demonstrate that activist monetary interventions (e.g. deviations from straightforward rules of thumb like the Taylor Rule) have unreliable, weak, and lagging effects on the real economy. “Moreover, as we should have learned from the global financial crisis, when the Fed holds interest rates down for so long that investors begin reaching for yield by speculating in the financial markets and making low-quality loans, the entire financial system becomes dangerously prone to future crises. The fact is that a quarter-point hike comes too late to avert the consequences of years of speculation, and while the hike itself will have little economic effect, the timing is ironic because a recession is already likely. The main effect of a rate hike will be to add volatility to an already speculative and now increasingly risk-averse market. The Fed’s real policy error, as it was during the housing bubble, was to hold interest rates so low for so long in the first place, encouraging years of yield-seeking speculation and malinvestment by doing so.” Though central bankers and talking heads on television speak about monetary policy as if it has a large and predictable impact on the real economy, decades of evidence underscore a weak and unreliable cause-and-effect relationship between the policy tools of the Fed and the targets (inflation, unemployment) that the Fed hopes to affect. One of the difficulties in evaluating the impact of monetary policy in recent years is that one can’t observe the relative aggressiveness of monetary policy using interest rates, once they hit zero. On that front, economists Cynthia Wu and Fan Dora Xia recently described a clever method to infer a “shadow” federal funds rate based on observable variables (see this University of Chicago article for a good discussion, and the original paper if you’re one of the five geeks who enjoy Kalman filtering, principal components analysis, and vector autoregression as much as I do). The chart below shows the Wu-Xia shadow rate versus the actual federal funds rate. Notably, the Fed doesn’t actually “control” the shadow rate directly, as it does when the Fed Funds rate is above zero. Rather, the shadow rate is statistically inferred using factors such as industrial production, the consumer price index, capacity utilization, the unemployment rate, housing starts, as well as forward interest rates and previously inferred shadow rates. While it’s very useful to have an estimate of what the “effective” Fed Funds rate might look like at any point in time, be careful not to misinterpret what the shadow rate measures. Again, once interest rates hit zero, the Wu-Xia shadow rate stops being a measure of something that is directly controlled by the Fed. Rather, it measures the possibly negative “shadow” interest rate that would be consistent with the behavior of other observable economic variables. Like the rate of inflation, it’s not at all clear that the Fed can actively manage a negative shadow federal funds rate in a reliably predictable way. In any event, what’s striking from Wu and Xia’s paper is how feeble the estimated impact of QE has been on the real economy. Using vector autoregressions to estimate the trajectory of the economy under various monetary policy assumptions, Wu and Xia observe: “In the absence of expansionary monetary policy, in December 2013, the unemployment rate would be 0.13% higher... the industrial production index would have been 101.0 rather than 101.8... housing starts would be 11,000 lower (988,000 vs. 999,000).” Notably, the Wu-Xia plots of observed and counterfactual economic variables show the same result that we find in our own work: most of the progressive improvement in industrial production, capacity utilization, unemployment, and other economic variables since 2009 would have emerged regardless of activist Fed policy (see Extremes in Every Pendulum). We estimate that this also holds for the improvement in these variables since Wu and Xia's paper was published. Put simply, the Federal Reserve has created the third speculative bubble in 15 years in return for real economic improvements that amount to literally a fraction of 1% from where we would otherwise have been. It’s slightly amusing to hear alarm from some corners that the Wu-Xia rate has increased toward zero - as if the impact of this “tightening” on the real economy is something to be feared. That fear might be valid if there was a strong effect size linking changes in the shadow rate to changes in the real economy. But as Wu and Xia’s own work demonstrates, there is not. The entire global economy seems condemned to repeatedly suffer from deranged central bankers that wholly disregard the weak effect size of monetary policy on policy targets like employment and inflation, and equally disregard their responsibility for the disruptive economic collapses that have followed on the heels of Fed-induced yield-seeking speculation. In short, what we should fear is not the slight impact of recent policy normalizations, but the violent, delayed, yet inevitable consequences of years of speculative distortions that are already fully baked in the cake. What we should fear are the Fed’s repeated and deranged attempts to achieve weak effects on the real economy, at the cost of speculative distortions that exact ten times the damage when they unwind. What we should fear is more of the same Fed recklessness that encouraged a yield-seeking bubble in mortgage debt, enabling a housing bubble that collapsed to create the worst economic crisis since the Great Depression. What we should fear is Fed policy that has encouraged a yield-seeking bubble in equities, debt-financed stock repurchases, and covenant-lite junk debt; that has carried capitalization-weighted valuations to the second greatest extreme in history other than the 2000 peak, and median equity valuations to the highest level ever recorded. That’s exactly what the Fed has done in recent years, and the cost of that unwinding is still ahead. When stocks crash and easy money doesn’t help One of the central themes that I’ve emphasized over time is how dependent various investment outcomes are on the condition of market internals, measured across a broad range of individual stocks, industries, sectors, and security types, including debt securities of varying creditworthiness. We’re often asked which “indicator” we use to gauge market internals, but to ask about a single indicator is to miss the concept. The best way to draw information from noisy data is to extract a joint signal from multiple sensors. In the financial markets, this involves the consideration of breadth, leadership, participation, correlation, dispersion, spread behavior, divergence, and other characteristics that can be measured from the co-movement of thousands of securities. Still, the central concept is very simple: when investors are inclined to embrace risk, they tend to be indiscriminate about it, so uniformity of market internals is the most historically reliable measure of risk-seeking we’ve identified. When market internals are favorable, overvalued markets tend to be relatively stable, and are inclined to become even more overvalued. It’s when internals deteriorate that overvaluation finally exerts itself in collapsing prices. When market internals are favorable, weak leading economic data is often reversed over the following months. Once internals deteriorate, weak leading economic data is almost always associated with recession. Likewise, when market internals are favorable, monetary easing reliably supports speculation (see All Their Eggs In Janet’s Basket). In contrast, once a steeply overvalued market is joined by unfavorable market internals, even persistent and aggressive Fed easing is associated with market losses, on average. Investors should remember this from the 2000-2002 and 2007-2009 collapses, but somehow the simplistic idea that “Fed easing makes stocks go up” is too ingrained to consider the actual evidence. Some of the most widely circulated charts in recent years showed two diagonal lines, one being the size of the Federal Reserve’s balance sheet, and the other being the level of the S&P 500. These charts were usually coupled with the observation that since 2009, the correlation between the two has been about 97%. The problem with such amateur statistics is that any two diagonal lines will always be nearly perfectly correlated, simply by virtue of how correlation is calculated. For example, the Fed’s balance sheet also has a 97% correlation with the price of beer in Iceland, and a 98% correlation with the number of internet users in Tuvalu, all the way to the beginning of that data in the 1990’s. See, correlation is calculated by examining how far two variables are from their respective averages. If X is well above its average when Y is above its average, and X is below its average when Y is below its average, then you’ll get a very high correlation. But this will always be true when X and Y have diagonal trends, so that both start well below the average level and end well above the average level. Correlation is only an interesting statistic if it holds up across several cycles of fluctuation; when changes in one variable are clearly associated with changes in the other variable, regardless of the direction of change. When we examine the data from that perspective, we observe something that many investors apparently fail to appreciate: increases in the Fed’s balance sheet have only been positively associated with increases in the S&P 500, on average, when the S&P 500 was already in an uptrend and investors were already inclined to speculate. There is a reason for this. Every dollar of monetary base created by the Federal Reserve has to be held by someone until it is retired. When investors are inclined to speculate, so that the allure of a higher return outweighs concerns about a capital loss, safe, low-interest liquidity is seen as an inferior asset. Holders are inclined to pass it off to someone else in return for a riskier security. The seller, who gets the cash, then tries to pass that hot potato on to yet someone else. In contrast, when investors become risk-averse, safe, low-interest liquidity is a desirable asset, because concerns about potentially deep capital losses on risky securities outweigh the discomfort of earning a low yield on safe ones. That’s not to rule out the possibility that central bank easing might, accompanied by other factors, encourage a shift from risk-averse to risk-seeking behavior. In March 2009, that “other factor” was the change in FASB accounting rules that abandoned mark-to-market accounting, allowed banks “significant judgment” in valuing their bad assets, and removed the specter of widespread bank defaults. Still, on average, Fed easing doesn’t help stocks when market internals are unfavorable. Don’t think for a second that it was Fed easing alone that sent stocks higher in 2009. The Fed was aggressively easing through the entire collapse, as it was during the tech collapse and the Great Depression. The following charts offer some visual perspective on this point. While we get stronger results using our own broad measures of internals, I chose to measure market action here using only the position of the S&P 500 versus its 200-day average, so that others can easily replicate these results if they wish. The first chart shows the scenario that investors seem to carry in their minds about recent years. Since mid-2008, when the S&P 500 has been above its 200-day moving average at the beginning of any 3-month period, quarterly changes in the monetary base have been positively related, on average, to changes in the S&P 500. It’s not a tight relationship by any means (R-squared of 0.0867 means that quarterly changes in the monetary base explain only 8.67% of the quarterly variation in returns, and implies a correlation of just 0.29), but at least the relationship is positive.
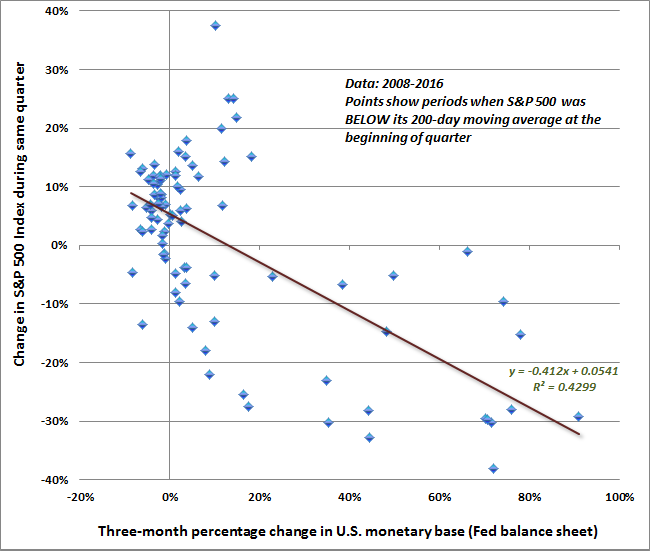
In contrast, the next chart shows the relationship between the monetary base and the S&P 500 since mid-2008 in 3-month periods when the S&P 500 was below its 200-day average at the beginning of the period. The relationship is steeply negative and explains 43% of the variation in returns (correlation -0.66). Put simply, the faster the S&P 500 fell, the more the Fed eased. Conversely, the more the Fed eased, the faster the S&P 500 fell. The direction of causality isn’t clear. While steep market losses can certainly panic the Fed into massive but futile attempts to ease monetary policy, it’s not implausible that Fed easing could also accelerate losses in a declining stock market. Fed easing is accomplished by buying up Treasury securities, and paying for them by creating currency and bank reserves. When stocks plunge in a weakening economy with low inflation, bonds typically advance in price, which creates a particularly useful kind of diversification. By removing those bonds from circulation, Fed easing in that environment actually increases the aggregate risk profile of private investor portfolios, which could provoke even greater selling pressure. In any case, Fed easing doesn’t help stocks in an environment where investors are risk-averse. The same result holds in market cycles across history.
Interestingly, when we examine the change in the monetary base in one quarter versus the change in the S&P 500 the following quarter, the relationship is actually negative regardless of whether the S&P 500 was rising or falling at the start of the quarter, but it’s a much stronger negative relationship if the S&P 500 was already in a downtrend. To summarize all of this, Fed easing certainly deserves the principal blame for both the housing bubble and the recent QE bubble. But the story is more nuanced than the popular belief that Fed easing somehow just makes stocks go up. Investors should recognize the pattern of activity that produced those bubbles. Specifically, in periods when investors were already inclined to speculate, as indicated by favorable market action as of the beginning of the period, Fed easing was associated with concurrent gains in stocks. The magnitude of the easing wasn’t tightly related to the magnitude of the gains, but the impact on stocks was clearly positive, on average. That said, because the Fed encouraged speculation at rich valuations, more aggressive easing in one quarter tended to be associated with consolidation the next, unless the Fed maintained its aggressiveness. In contrast, in periods where investors had shifted to risk-aversion, as indicated by unfavorable or divergent market internals at the beginning of the period, the magnitude of Fed easing was significantly correlated with the magnitude of market losses. That is, Fed easing not only failed to help stocks, but actually mirrored the steepness of the collapse. If the Fed had eased aggressively in the preceding quarter, but market internals were still unfavorable at the end of that quarter, stocks typically lost additional ground over the following 3-month period. During the period from 2009 to 2014, it was precisely the untethered, deranged monetary aggressiveness of a dogmatic Ben Bernanke that allowed the market to persistently advance, despite the repeated emergence of extreme overvalued, overbought, overbullish syndromes that had reliably been followed by market losses in prior cycles across history. Our main challenge in this period was that we responded directly to those overvalued, overbought, overbullish syndromes, as the historical record had encouraged. But in the face of yield-seeking speculation supported by QE, one had to wait until market internals deteriorated explicitly before taking a hard-negative outlook on stocks. We had to make adaptations on that front, and I incorporated that restriction into our own work in mid-2014 (see A Better Lesson Than “This Time Is Different”). Since then, internals have deteriorated badly. Understand that the risk-seeking conditions that deferred downside consequences during most of the period from 2009 through mid-2014 are no longer present. Again, as usual, I'll emphasize that the immediacy of our downside concerns would ease if market internals were to improve materially. We see exactly the opposite here. Recall that the main consideration driving my shift to a hard-negative outlook at both the 2000 and 2007 market peaks was an extended period of overvalued, overbought, overbullish conditions had been joined by deterioration in market internals. We moved to recession warnings in October 2000 and November 2007 as well. Every market cycle is different, but I simply don’t observe historically relevant differences that are likely to make the consequences of the recent bubble much less unpleasant than the other two. My hope is that, by now, you've taken the opportunity to ensure that your investment exposures would allow you to tolerate a further 40-50% market retreat without abandoning your discipline (even if that discipline is a passive buy-and-hold strategy). A market loss in that range would be a fairly run-of-the-mill completion to the current cycle given recent valuation extremes. See Rarefied Air: Valuations and Subsequent Market Returns if such losses seem preposterous to you. I suspect that it will shortly be too late to reduce market exposure at advantageous levels. I'm convinced that the completion of this market cycle will provide significant opportunities to build exposure at valuations that imply far stronger long-term return prospects.The foregoing comments represent the general investment analysis and economic views of the Advisor, and are provided solely for the purpose of information, instruction and discourse. Please see periodic remarks on the Fund Notes and Commentary page for discussion relating specifically to the Hussman Funds and the investment positions of the Funds. --- The foregoing comments represent the general investment analysis and economic views of the Advisor, and are provided solely for the purpose of information, instruction and discourse. Prospectuses for the Hussman Strategic Growth Fund, the Hussman Strategic Total Return Fund, the Hussman Strategic International Fund, and the Hussman Strategic Dividend Value Fund, as well as Fund reports and other information, are available by clicking "The Funds" menu button from any page of this website. |
|||||||||||||||||||||||||
|
For more information about investing in the Hussman Funds, please call us at
1-800-HUSSMAN (1-800-487-7626) 513-326-3551 outside the United States Site and site contents © copyright Hussman Funds. Brief quotations including attribution and a direct link to this site (www.hussmanfunds.com) are authorized. All other rights reserved and actively enforced. Extensive or unattributed reproduction of text or research findings are violations of copyright law. Site design by 1WebsiteDesigners. |